Stock Portfolio Organizer
The ultimate porfolio management solution.
Shares, Margin, CFD's, Futures and Forex
EOD and Realtime
Dividends and Trust Distributions
And Much More ....
WiseTrader Toolbox
#1 Selling Amibroker Plugin featuring:
Advanced Adaptive Indicators
Advanced Pattern Exploration
Neural Networks
And Much More ....
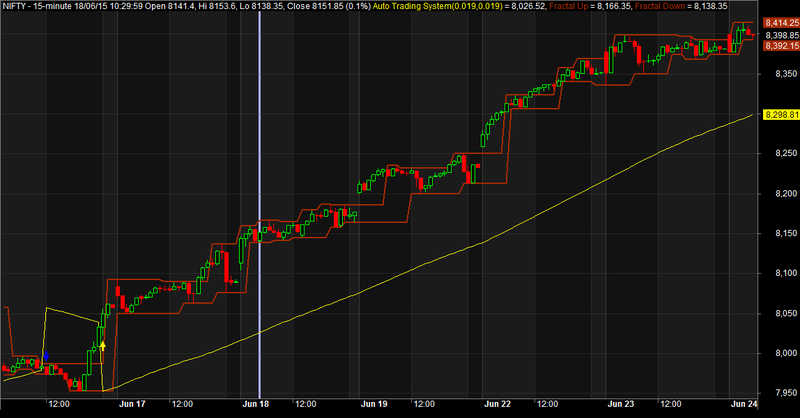
Fractal breakout best use 5/15mins for Amibroker (AFL)
Rating:
4 / 5 (Votes 6)
Tags:
amibroker, fractal
DEFINITION of ‘Fractal’
A type of pattern used in technical analysis to predict a reversal in the current trend. A fractal pattern consists of five bars and is identified when the price meets the following characteristics:
1. A shift from a downtrend to an uptrend occurs when the lowest bar is located in the middle of the pattern and two bars with successively higher lows are positioned around it.
2. A shift from an uptrend to a downtrend occurs when the highest bar is located in the middle of the pattern and two bars with successively lower highs are positioned around it.
Read more: Here…
Follow us: @Investopedia on Twitter
Screenshots
Indicator / Formula
Copy & Paste Friendly
1 2 3 4 5 6 7 8 9 10 11 12 13 14 15 16 17 18 19 20 21 22 23 24 25 26 27 28 29 30 31 32 33 34 35 36 37 38 39 40 41 42 43 44 45 46 47 48 49 50 51 52 53 54 55 56 57 58 59 60 61 62 63 64 65 66 67 68 69 70 71 72 73 74 75 76 77 78 79 80 81 82 83 84 85 86 87 88 | _SECTION_BEGIN("Price");SetChartOptions(0,chartShowArrows|chartShowDates);p23 = Param("Value",100000,0,1000000,1);SetPositionSize(p23,spsValue);_SECTION_BEGIN("Price");SetChartOptions(0,chartShowArrows|chartShowDates);_N(Title = StrFormat("{{NAME}} - {{INTERVAL}} {{DATE}} Open %g, Hi %g, Lo %g, Close %g (%.1f%%) {{VALUES}}", O, H, L, C, SelectedValue( ROC( C, 1 ) ) ));Plot( C, "Close", ParamColor("Color", colorBlack ), styleNoTitle | ParamStyle("Style") | GetPriceStyle() );_SECTION_END();_SECTION_BEGIN("Auto Trading System");acc = Param("Acceleration", 0.019, 0, 1, 0.001 );accm = Param("Max. acceleration", 0.019, 0, 1, 0.001 );Plot( SAR( acc, accm ), _DEFAULT_NAME(), ParamColor( "Color", colorYellow ),ParamStyle("Style", styleLine | styleLine, maskDefault | styleLine | styleLine ));Buy = Cross(Open, SAR(acc,accm));Sell = Cross(SAR(acc,accm), Open );Short=Sell;Cover=Buy;PlotShapes(IIf(Buy,shapeUpArrow,shapeNone), colorYellow, 0, Low, Offset=-15);PlotShapes(IIf(Sell, shapeDownArrow,shapeNone), colorBlue, 0, High,Offset=-15);AlertIf( Buy, "SOUND C:\\Windows\\Media\\Chord.wav", "Audio alert", 2 );AlertIf( Sell, "SOUND C:\\Windows\\Media\\Ding.wav", "Audio alert", 2 );Filter = Buy OR Sell;AddColumn( Buy, "Buy", 1);AddColumn( Sell, "Sell", 1);_SECTION_END();_SECTION_BEGIN("BW Fractal");//Fractal upFUp = ((Ref(H,-4)<Ref(H,-2)) AND (Ref(H,-3)<Ref(H,-2)) AND (Ref(H,-1) <Ref(H,-2)) AND (H <Ref(H,-2))) OR ((Ref(H,-5)<Ref(H,-2)) AND (Ref(H,-4)<Ref(H,-2)) AND (Ref(H,-3)<=Ref(H,-2)) AND (Ref(H,-1)< Ref(H,-2)) AND (H <Ref(H,-2))) OR ((Ref(H,-6)<Ref(H,-2)) AND (Ref(H,-5)<Ref(H,-2)) AND (Ref(H,-4)<=Ref(H,-2)) AND (Ref(H,-3)<=Ref(H,-2)) AND (Ref(H,-1)<Ref(H,-2)) AND (H <Ref(H,-2))) OR ((Ref(H,-7)<Ref(H,-2)) AND (Ref(H,-6)<Ref(H,-2)) AND (Ref(H,-5)<=Ref(H,-2)) AND (Ref(H,-4)<=Ref(H,-2)) AND (Ref(H,-3)<=Ref(H,-2)) AND (Ref(H,-1)<Ref(H,-2)) AND (H <Ref(H,-2))) OR ((Ref(H,-8)<Ref(H,-2)) AND (Ref(H,-7)<Ref(H,-2)) AND (Ref(H,-6)<=Ref(H,-2)) AND (Ref(H,-5)<=Ref(H,-2)) AND (Ref(H,-4)<=Ref(H,-2)) AND (Ref(H,-3)<=Ref(H,-2)) AND (Ref(H,-1)<Ref(H,-2)) AND (H <Ref(H,-2)));FractalUp = ValueWhen(FUp ,Ref(H,-2) ,1); FUpBuyPrice = FractalUp + 0.01;FUpHit = FUpBuyPrice <= H AND FUpBuyPrice >= L;FUpSignalOn = Flip(Ref(FractalUp,-1) != FractalUp, FUpHit);//Fractal DownFDown= ((Ref(L,-4)>Ref(L,-2)) AND (Ref(L,-3)>Ref(L,-2)) AND (Ref(L,-1) >Ref(L,-2)) AND (L > Ref(L,-2))) OR ((Ref(L,-5)>Ref(L,-2)) AND (Ref(L,-4)>Ref(L,-2)) AND (Ref(L,-3)>=Ref(L,-2)) AND (Ref(L,-1) >Ref(L,-2)) AND (L > Ref(L,-2))) OR ((Ref(L,-6)>Ref(L,-2)) AND (Ref(L,-5)>Ref(L,-2)) AND (Ref(L,-4)>=Ref(L,-2)) AND (Ref(L,-3)>=Ref(L,-2)) AND (Ref(L,-1) >Ref(L,-2)) AND (L > Ref(L,-2))) OR ((Ref(L,-7)>Ref(L,-2)) AND (Ref(L,-6)>Ref(L,-2)) AND (Ref(L,-5)>=Ref(L,-2)) AND (Ref(L,-4)>=Ref(L,-2)) AND (Ref(L,-3)>=Ref(L,-2)) AND (Ref(L,-1)> Ref(L,-2)) AND (L > Ref(L,-2))) OR ((Ref(L,-8)>Ref(L,-2)) AND (Ref(L,-7)>Ref(L,-2)) AND (Ref(L,-6)>=Ref(L,-2)) AND (Ref(L,-5)>=Ref(L,-2)) AND (Ref(L,-4)>=Ref(L,-2)) AND (Ref(L,-3)>=Ref(L,-2)) AND (Ref(L,-1)> Ref(L,-2)) AND (L >Ref(L,-2)));FractalDown=ValueWhen(FDown, Ref(L,-2), 1);FDownSellPrice= FractalDown+ 0.01;FDownHit = FDownSellPrice <= H AND FDownSellPrice >= L;FDownSignalOn = Flip(Ref(FractalDown,-1) != FractalDown, FDownHit );FractalBuy = Cross(C,FractalUp);FractalSell = Cross(FractalDown,C);//Plot Fractal on the titleShowFSign = ParamToggle("Display Fractal Point", "No|Yes", 1);ShowBSign = ParamToggle("Display Fractal Buy/Sell", "No|Yes", 1);//PlotShapes(IIf(FractalBuy AND ShowBSign, shapeUpArrow, 0) ,colorCustom11, 0, L);//PlotShapes(IIf(FractalSell AND ShowBSign, shapeDownArrow, 0) ,colorRed, 0, H);Plot(Ref(FractalUp,4), "Fractal Up", ParamColor("Fractal Up Color", colorBrown) , ParamStyle("Fractal Up Style",styleLine|styleThick));Plot(Ref(FractalDown,4), "Fractal Down", ParamColor("Fractal Down Color", colorBrown), ParamStyle("Fractal Down Style",styleLine|styleThick));//PlotOHLC(Ref(FractalUp,4),Ref(FractalDown,4),Ref(FractalUp,4),Ref(FractalDown,4),"",colorAqua,styleCloud|4096,0,0,0);//Looks into the future. This is done only to display Fractal arrow at the right bar.//The calculation of the fractal up is done without looking into the future.//PlotShapes(IIf((Ref(FractalUp,2) != Ref(FractalUp,1)) AND ShowFSign, shapeSmallCircle, shapeNone), colorWhite,0,Ref(FractalUp,2), 12);//PlotShapes(IIf((Ref(FractalDown,2) != Ref(FractalDown,1)) AND ShowFSign, shapeSmallCircle, shapeNone), colorPink,0,Ref(FractalDown,2), -12);_SECTION_END(); |
2 comments
Leave Comment
Please login here to leave a comment.
Back
Hi
I have seen the above AFL.
I was wanting to know more on how to execute using this. Can you guide me or contact me on varun.dalmia@gmail.com
Regards
Varun
Dear Varun,
Sorry for delayed reply
I would like to explain this indicator as most reliable and rate this indicator for sensing trend very early.
I would request to go thru some of the you tube videos / articles online and rest for this formula pls check arrows is already plotted for ready reference.
Happy trading.