Stock Portfolio Organizer
The ultimate porfolio management solution.
Shares, Margin, CFD's, Futures and Forex
EOD and Realtime
Dividends and Trust Distributions
And Much More ....
WiseTrader Toolbox
#1 Selling Amibroker Plugin featuring:
Advanced Adaptive Indicators
Advanced Pattern Exploration
Neural Networks
And Much More ....
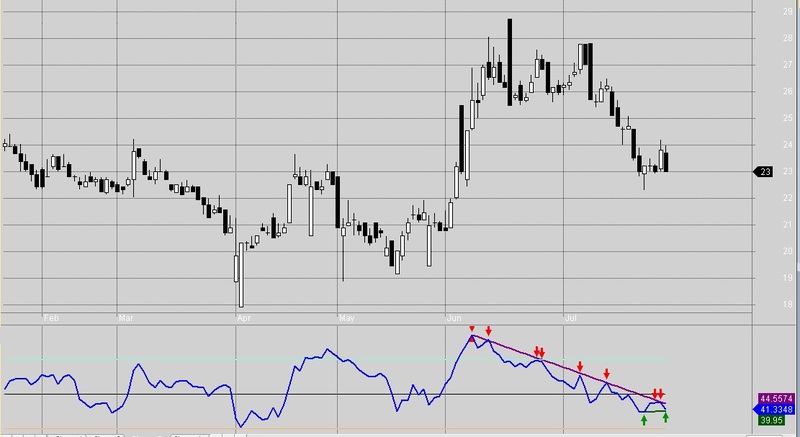
MFI with top and bot signal for Amibroker (AFL)
Rating:
5 / 5 (Votes 7)
Tags:
oscillator, amibroker
This indicator based on MFI formula with top and bot signal
Screenshots
Indicator / Formula
Copy & Paste Friendly
_SECTION_BEGIN("MFI trend");

SetBarsRequired(sbrAll, sbrAll);
TP = Param("Trend Per", 70,2,100);
per_MFI= Param("MFI Per", 9, 5, 35,1);
IND =  MFI(per_MFI);
Center = 50 ;

Plot( MFI(per_MFI), "",colorblue, 4, 4);

SetChartOptions(0,0,0,0,0);
maxClip = Param( "maxClip", 80, 1, 100, 1 );
minClip = Param( "minClip", 20, 1, 100, 1 );

r = MFI(per_MFI);
PlotOHLC( r,r,50,r, "", IIf( r > 50, colorRed, colorBrightGreen ), styleCloud |
styleNoLabel | styleClipMinMax, minClip, maxClip );

Plot( 70, "", coloraqua, styleNoLabel  );
Plot( 50, "", colorblack, styleNoLabel  );
Plot( 30, "", colorlightorange, styleNoLabel  );

// CALCULATE  UPTREND

startvalue = LastValue( LLV( IND, TP ) );
startbar =  LastValue( ValueWhen( IND == startvalue, BarIndex(), 1) );
BP = BarCount - Startbar;

secondvalue =  LastValue( LLV( IND, BP - 5  ) );
secondbar =  LastValue( ValueWhen( IND == secondvalue, BarIndex(), 1) );
BP2 = BarCount - secondbar;

thirdvalue =  LastValue( LLV( IND, BP2 - 5 ) );
thirdbar =  LastValue( ValueWhen( IND == thirdvalue, BarIndex(), 1) );
BP3 = BarCount - thirdbar;

fourthvalue =  LastValue( LLV( IND, BP3 - 5 ) );
fourthbar =  LastValue( ValueWhen( IND ==fourthvalue, BarIndex(), 1) );
BP4 = BarCount - fourthbar;

fifthvalue =  LastValue( LLV( IND, BP4 - 5 ) );
fifthbar =  LastValue( ValueWhen( IND ==fifthvalue, BarIndex(), 1) );
BP5 = BarCount - fifthbar;

sixthvalue =  LastValue( LLV( IND, BP5 - 5 ) );
sixthbar =  LastValue( ValueWhen( IND ==sixthvalue, BarIndex(), 1) );

Low_1= IIf( BarIndex() == startbar, 80, Null);
Low_2= IIf( BarIndex() == secondbar, 80, Null);
Low_3= IIf( BarIndex() == thirdbar, 80, Null);
Low_4= IIf( BarIndex() == fourthbar, 80, Null);
Low_5= IIf( BarIndex() == fifthbar, 80, Null);
Low_6= IIf( BarIndex() == sixthbar, 80, Null);

b = startvalue ;
FirstSlope = (secondvalue - b) / (secondbar - startbar) ;
FirstTrendline = FirstSlope * ( BarIndex() - startbar ) + b;
// Plot(  IIf(  BarIndex() >= startbar  AND FirstTrendline <= 90 , FirstTrendline, Null ) , "FirstTrendline", colorGreen, styleThick +2048 );

SecondSlope = (thirdvalue - b) / (thirdbar - startbar) ;
SecondTrendline = SecondSlope * ( BarIndex() - startbar ) + b;

ThirdSlope = (fourthvalue - b) / (fourthbar - startbar) ;
ThirdTrendline = ThirdSlope * ( BarIndex() - startbar ) + b;

FourthSlope = (fifthvalue - b) / (fifthbar - startbar) ;
FourthTrendline = FourthSlope * ( BarIndex() - startbar ) + b;

FifthSlope = (sixthvalue - b) / (sixthbar - startbar) ;
FifthTrendline = FifthSlope * ( BarIndex() - startbar ) + b;

MainSlope = IIf( FirstSlope > SecondSlope,  IIf( SecondSlope > ThirdSlope,  IIf( ThirdSlope > FourthSlope,
 IIf( FourthSlope >  FifthSlope,  FifthSlope, FourthSlope),ThirdSlope), SecondSlope), FirstSlope) ;

MainLine = MainSlope * ( BarIndex() - startbar ) + b;
Plot(  IIf(  BarIndex() >= startbar, MainLine, Null ) , "MainLine", colorDarkGreen, styleThick ) ;


IND_Diff = IIf(  BarIndex() >= startbar, abs( IND - MainLine), Null) ;
MainTrendLine_Diff = Param("Difference IND from MainTrendLine", 2.5, 0.5,5,  0.5);

Cond_Buy = IIf( BarIndex() >= Thirdbar AND  IND_Diff  <= MainTrendLine_Diff, IND, 0)  AND  MainLine < 55 ;

PlotShapes( IIf( Cond_Buy, shapeUpArrow , shapeNone ), colorGreen );


/////////////////////////////////////////////

// CALCULATE  DOWNTREND

starthigh = LastValue( HHV( IND, TP ) );
starthighbar =  LastValue( ValueWhen( IND == starthigh, BarIndex(), 1) );
HBP = BarCount - starthighbar;

secondhigh =  LastValue( HHV( IND, HBP - 5  ) );
secondhighbar =  LastValue( ValueWhen( IND == secondhigh, BarIndex(), 1) );
HBP2 = BarCount - secondhighbar;

thirdhigh =  LastValue( HHV( IND, HBP2 - 5 ) );
thirdhighbar =  LastValue( ValueWhen( IND == thirdhigh, BarIndex(), 1) );
HBP3 = BarCount - thirdhighbar;

fourthhigh =  LastValue( HHV( IND, HBP3 - 5 ) );
fourthhighbar =  LastValue( ValueWhen( IND ==fourthhigh, BarIndex(), 1) );
HBP4 = BarCount - fourthhighbar;

fifthhigh =  LastValue( HHV( IND, HBP4 - 5 ) );
fifthhighbar =  LastValue( ValueWhen( IND ==fifthhigh, BarIndex(), 1) );
HBP5 = BarCount - fifthhighbar;

sixthhigh =  LastValue( HHV( IND, HBP5 - 5 ) );
sixthhighbar =  LastValue( ValueWhen( IND ==sixthhigh, BarIndex(), 1) );

High_1= IIf( BarIndex() == starthighbar, 90, Null);
High_2= IIf( BarIndex() == secondhighbar, 90, Null);
High_3= IIf( BarIndex() == thirdhighbar, 90, Null);
High_4= IIf( BarIndex() == fourthhighbar, 90, Null);
High_5= IIf( BarIndex() == fifthhighbar, 90, Null);
High_6= IIf( BarIndex() == sixthhighbar, 90, Null);

MainTrendLine_Diff = Param("Difference IND from MainTrendLine", 2.5, 0.5,7,  0.5);

d = starthigh ;
FirstDownSlope = (secondhigh - d) / (secondhighbar - starthighbar) ;
FirstDownTrendline = FirstDownSlope * ( BarIndex() - starthighbar ) + d;

SecondDownSlope = (thirdhigh - d) / (thirdhighbar - starthighbar) ;
SecondDownTrendline = SecondDownSlope * ( BarIndex() -  starthighbar ) + d;

ThirdDownSlope = (fourthhigh - d) / (fourthhighbar - starthighbar) ;
ThirdDownTrendline = ThirdDownSlope * ( BarIndex() - starthighbar ) + d;

FourthDownSlope = (fifthhigh - d) / (fifthhighbar - starthighbar) ;
FourthDownTrendline = FourthDownSlope * ( BarIndex() - starthighbar ) + d;

FifthDownSlope = (sixthhigh - d) / (sixthhighbar - starthighbar) ;
FifthDownTrendline = FifthDownSlope * ( BarIndex() - starthighbar ) + d;

MainDownSlope = IIf( FirstDownSlope < SecondDownSlope,  IIf( SecondDownSlope < ThirdDownSlope,
IIf( ThirdDownSlope < FourthDownSlope,  IIf( FourthDownSlope <  FifthDownSlope, FifthDownSlope, FourthDownSlope),ThirdDownSlope), SecondDownSlope), FirstDownSlope) ;

MainDownLine =  IIf( MainDownSlope == 0, Null, MainDownSlope * ( BarIndex() - starthighbar ) + d ) ;
Plot(  IIf(  BarIndex() >=  starthighbar, MainDownLine, Null ) , "Main_DOWN_Line", colorViolet, styleThick ) ;

IND_Diff = IIf(  BarIndex() >=  starthighbar, abs( IND - MainDownLine), Null) ;

Cond_Sell = IIf( BarIndex() >= Thirdbar AND  IND_Diff  <= MainTrendLine_Diff, IND, 0)  AND  MainDownLine > 45 ;

PlotShapes( IIf( Cond_Sell, shapeDownArrow , shapeNone ), colorRed );


Title =  Name() + "\\c17" +   "  " +"\\c12" + per_mfi;
_SECTION_END();
2 comments
Leave Comment
Please login here to leave a comment.
Back
nice
excellent