Stock Portfolio Organizer
The ultimate porfolio management solution.
Shares, Margin, CFD's, Futures and Forex
EOD and Realtime
Dividends and Trust Distributions
And Much More ....
WiseTrader Toolbox
#1 Selling Amibroker Plugin featuring:
Advanced Adaptive Indicators
Advanced Pattern Exploration
Neural Networks
And Much More ....
Modified RSI Indicator(5) for Amibroker (AFL)
Rating:
4 / 5 (Votes 5)
Tags:
oscillator, amibroker
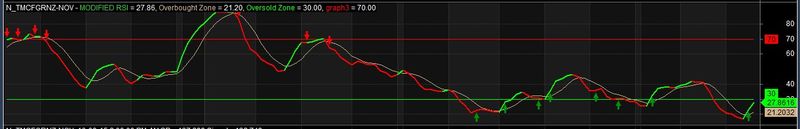
This modified RSI Indicator shall be used with the basic candle pattern to identify the positive and negative divergences.But check the other candles while using the buy sell signals.Good luck.
Screenshots
Indicator / Formula
Copy & Paste Friendly
_SECTION_BEGIN("MODIFIED RSI by Gowtham ");
SetChartBkColor(ParamColor("Panel color ",colorBlack));
//hellogowtham@gmail.com
RP = Param("RSI",7,2,20,1);
UL= Param("Upper Limit",70,0,100,1);
LL= Param("Lower Limit",30,0,100,1);
PlotGrid(UL,colorBlue);
PlotGrid(LL,colorBlue);
R= RSIa(C, RP);
Plot(R, "MODIFIED RSI",  colorLime, styleThick);

Overbought=70;
Oversold=30;
Plot(Overbought,"Overbought Zone",colorBlue);
Plot(Oversold,"Oversold Zone",colorGreen);

Overbought=70;
Oversold=30;
Buy = Cross(R, Oversold) AND R > Oversold;
Sell = Cross(Overbought, R) AND R < Overbought;

PlotShapes(IIf(Sell, shapeDownArrow , shapeNone), colorRed);
PlotShapes(IIf(Buy, shapeUpArrow , shapeNone), colorGreen);

_SECTION_END();

MaxGraph=10;
Period1=Param("Period 1", 10, 5, 50, 1);
Period2=Param("Period 2", 10, 5, 50, 1);
EMA1= EMA(R,Period1);
EMA2= EMA(EMA1,Period2);
Difference= EMA1 - EMA2;
ZeroLagEMA= EMA1 + Difference;
PR=abs(ZeroLagEMA);

Graph0=PR;

MoveAvg=MA(PR,5);

Graph1=MoveAvg;          //Remove the // if you want a Crossover MA to plot
Graph1Color=colorTan;

Graph0Style=4;
upbar= PR>= MoveAvg AND PR>= Ref(PR,-1) ;
downbar=(PR < MoveAvg) OR PR>= MoveAvg AND PR< Ref(PR,-1) ;
barcolor = IIf( downbar,colorRed, IIf( upbar, colorBrightGreen, 7));
Graph0BarColor = ValueWhen( barcolor != 0, barcolor );
Graph2=30;
Graph3=70;

Graph2Style=Graph3Style=Graph4Style=1;
Graph4Color=2;
Graph2Color=5;
Graph3Color=4;
0 comments
Leave Comment
Please login here to leave a comment.
Back