Stock Portfolio Organizer
The ultimate porfolio management solution.
Shares, Margin, CFD's, Futures and Forex
EOD and Realtime
Dividends and Trust Distributions
And Much More ....
WiseTrader Toolbox
#1 Selling Amibroker Plugin featuring:
Advanced Adaptive Indicators
Advanced Pattern Exploration
Neural Networks
And Much More ....
Supertrend V4.0 for Amibroker (AFL)
Rating:
3 / 5 (Votes 4)
Tags:
amibroker
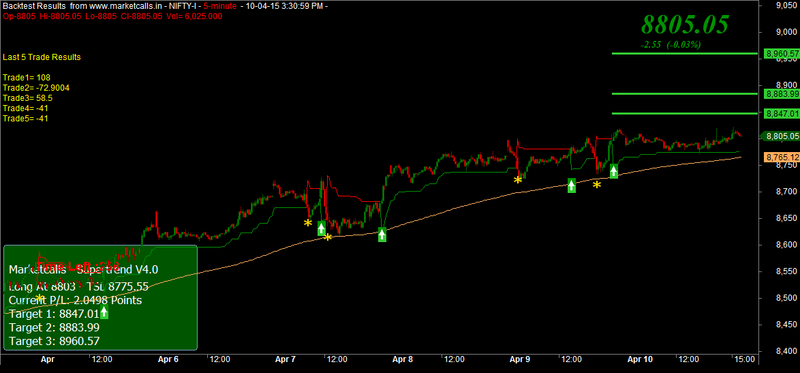
Supertrend V4.0 by Rajandran from http://www.marketcalls.in/
Compared to Supertrend 3.0 with the new version two interesting features has been added. One is a simple EMA filter rule is added to Buy and Short Conditions and changes in the dashboard (included target levels in Supertrend Dashboard for discrete traders). And performance of Trading system is really interesting when comes to backtesting with Nifty and Bank Nifty Futures. Recorded Webinar of Supertrend and Filters posted down below.
Screenshots
Indicator / Formula
Copy & Paste Friendly
/* Done by    Rajandran R  */
/* Author of www.marketcalls.in  */

function GetSecondNum()
{
    Time = Now( 4 );
    Seconds = int( Time % 100 );
    Minutes = int( Time / 100 % 100 );
    Hours = int( Time / 10000 % 100 );
    SecondNum = int( Hours * 60 * 60 + Minutes * 60 + Seconds );
    return SecondNum;
}

function PopupWindowEx( popupID, bodytext, captiontext, timeout, left, top )
{
    displayText = bodytext + captiontext;
    if ( ( StaticVarGetText( "prevPopup" + popupID ) != displayText) OR ( StaticVarGet( "prevPopupTime" + popupID ) < GetSecondNum() ) )
    {
        StaticVarSetText( "prevPopup" + popupID, displayText);
        StaticVarSet( "prevPopupTime" + popupID, GetSecondNum() + timeout );
        PopupWindow( bodytext, Captiontext + popupID, timeout, Left, top );
        PlaySound("c:\\windows\\media\\ding.wav");
    }
}

_SECTION_BEGIN("SuperTrend Ver 4");

SetBarsRequired(100000,0);


GraphXSpace = 15;

SetChartOptions(0,chartShowArrows|chartShowDates);

SetChartBkColor(ParamColor("bkcolor",ColorRGB(0,0, 0)));

GfxSetBkMode(0);

GfxSetOverlayMode(1);

SetBarFillColor(IIf(C>O,ParamColor("Candle UP Color", colorGreen),IIf(C<=O,ParamColor("Candle Down Color", colorRed),colorLightGrey)));

Plot(C,"\nPrice",IIf(C>O,ParamColor("Wick UP Color", colorDarkGreen),IIf(C<=O,ParamColor("Wick Down Color", colorDarkRed),colorLightGrey)),64,0,0,0,0);


SetTradeDelays(1,1,1,1);

SetPositionSize(100,spsShares);


sig = 0;
bars =0;
tar1 =0;
tar2 = 0;
tar3=0;


_N(Title = StrFormat("{{NAME}} - {{INTERVAL}} {{DATE}} Open %g, Hi %g, Lo %g, Close %g (%.1f%%) {{VALUES}}", O, H, L, C, SelectedValue( ROC( C, 1 ) ) ));


Factor=optimize("Factor",4,1,3,1);

Pd=optimize("ATR Periods",8,1,100,1);


Up=(H+L)/2+(Factor*ATR(Pd));

Dn=(H+L)/2-(Factor*ATR(Pd));

iATR=ATR(Pd);

TrendUp=TrendDown=Null;

trend[0]=1;

changeOfTrend=0;

flag=flagh=0;


for (i = 1; i <BarCount-1; i++) {

      TrendUp[i] = Null;

      TrendDown[i] = Null;


      trend[i]=1;


      if (Close[i]>Up[i-1]) {

         trend[i]=1;

         if (trend[i-1] == -1) changeOfTrend = 1;


      }

      else if (Close[i]<Dn[i-1]) {

         trend[i]=-1;

         if (trend[i-1] == 1) changeOfTrend = 1;

      }

      else if (trend[i-1]==1) {

         trend[i]=1;

         changeOfTrend = 0;

      }

      else if (trend[i-1]==-1) {

         trend[i]=-1;

         changeOfTrend = 0;

      }


      if (trend[i]<0 && trend[i-1]>0) {

         flag=1;

      }

      else {

         flag=0;

      }


      if (trend[i]>0 && trend[i-1]<0) {

         flagh=1;

      }

      else {

         flagh=0;

      }


      if (trend[i]>0 && Dn[i]<Dn[i-1]){

         Dn[i]=Dn[i-1];

		}


      if (trend[i]<0 && Up[i]>Up[i-1])

        { Up[i]=Up[i-1];

		}


      if (flag==1)

       {  Up[i]=(H[i]+L[i])/2+(Factor*iATR[i]);;

        }

      if (flagh==1)

        { Dn[i]=(H[i]+L[i])/2-(Factor*iATR[i]);;

         }

      if (trend[i]==1) {

         TrendUp[i]=Dn[i];

         if (changeOfTrend == 1) {

            TrendUp[i-1] = TrendDown[i-1];

            changeOfTrend = 0;

         }

      }

      else if (trend[i]==-1) {

         TrendDown[i]=Up[i];

         if (changeOfTrend == 1) {

            TrendDown[i-1] = TrendUp[i-1];

            changeOfTrend = 0;

         }

      }

   }


Plot(TrendUp,"Trend",colorGreen);

Plot(TrendDown,"Down",colorRed);

Length =200;//Optimize("HMA",100,10,300,1);

Buy = trend==1 AND c>EMA(C,Length);
Sell=trend==-1 ;

Short=trend==-1  and C<EMA(C,Length);
Cover=trend==1;

Buy=ExRem(Buy,Sell);
Sell=ExRem(Sell,Buy);

short=ExRem(short,cover);
cover=ExRem(cover,short);

Long=Flip(Buy,Sell);
Shrt=Flip(Short,Cover);
Relax = NOT Long AND NOT Buy AND NOT shrt AND NOT Sell AND NOT Sell AND NOT Cover;

BarsSincebuy = BarsSince( Buy );
BarsSinceshort = BarsSince( Short );
LastSignal = IIf( BarsSincebuy < BarsSinceshort, 1, -1 );

BuyPrice=ValueWhen(Buy,C);
SellPrice=ValueWhen(Sell,C);
ShortPrice=ValueWhen(Short,C);
CoverPrice=ValueWhen(Cover,C);

Title = EncodeColor(colorWhite)+ "Super Trend AFL code from www.marketcalls.in" + " - " +  Name() + " - " + EncodeColor(colorRed)+ Interval(2) + EncodeColor(colorWhite) +

 "  - " + Date() +" - "+"\n" +EncodeColor(colorRed) +"Op-"+O+"  "+"Hi-"+H+"  "+"Lo-"+L+"  "+

"Cl-"+C+"  "+ "Vol= "+ WriteVal(V)+"\n"+

EncodeColor(colorLime)+

WriteIf (Buy , " GO LONG / Reverse Signal at "+C+"  ","")+

WriteIf (Sell , " EXIT LONG / Reverse Signal at "+C+"  ","")+"\n"+EncodeColor(colorYellow)+

WriteIf(Sell , "Total Profit/Loss for the Last Trade Rs."+(C-BuyPrice)+"","")+

WriteIf(Buy  , "Total Profit/Loss for the Last trade Rs."+(SellPrice-C)+"","");


PlotShapes(IIf(Buy, shapeSquare, shapeNone),colorGreen, 0, L, Offset=-40);
PlotShapes(IIf(Buy, shapeSquare, shapeNone),colorLime, 0,L, Offset=-50);
PlotShapes(IIf(Buy, shapeUpArrow, shapeNone),colorWhite, 0,L, Offset=-45);
PlotShapes(IIf(Short, shapeSquare, shapeNone),colorRed, 0, H, Offset=40);
PlotShapes(IIf(Short, shapeSquare, shapeNone),colorOrange, 0,H, Offset=50);
PlotShapes(IIf(Short, shapeDownArrow, shapeNone),colorWhite, 0,H, Offset=-45);

PlotShapes(IIf(Sell, shapeStar, shapeNone),colorGold, 0, L, Offset=-15);
PlotShapes(IIf(Cover, shapeStar, shapeNone),colorGold, 0,L, Offset=-15);

duration = 10000000;

LastClose= Ref(C,-1);  // if you like to add this popup will show you

if (Buy[BarCount-2]==true)
{
PopupWindowEx( "ID:1", "Get Ready to BUY  \n"+Name() + "  "+ Interval(2)+" :  "+ " Last ="+LastClose  , "Buy Alert -", 1000, 100, 1 ) ;
}
if (short[BarCount-2]==true)
{
PopupWindowEx( "ID:2", "Get Ready to SHORT  \n"+Name() + "  "+ Interval(2) + "  :  "+ " Last ="+LastClose , "Short   Alert ", 1000, 1, 150 ) ;
}


TrendSL=IIf(trend==1,TrendUp,TrendDown);


for(i=BarCount-1;i>1;i--)

{

if(Buy[i] == 1)

{

entry = C[i];

sig = "BUY";

sl = TrendSL[i];

tar1 = entry + (entry * .0050);

tar2 = entry + (entry * .0092);

tar3 = entry + (entry * .0179);


bars = i;

i = 0;

}

if(Sell[i] == 1)

{

sig = "SELL";

entry = C[i];

sl = TrendSL[i];

tar1 = entry - (entry * .0050);

tar2 = entry - (entry * .0112);

tar3 = entry - (entry * .0212);


bars = i;

i = 0;

}

}

Offset = 20;

SellSL=ValueWhen(Short,Ref(TrendSL,-1),1);
BuySL=ValueWhen(Buy,Ref(TrendSL,-1),1);


Clr = IIf(sig == "BUY", colorLime, colorRed);

ssl = IIf(bars == BarCount-1, TrendSL[BarCount-1], Ref(TrendSL, -1));

sl = ssl[BarCount-1];


Plot(LineArray(bars-Offset, tar1, BarCount, tar1,1), "", Clr, styleLine|styleDots, Null, Null, Offset);

Plot(LineArray(bars-Offset, tar2, BarCount, tar2,1), "", Clr, styleLine|styleDots, Null, Null, Offset);

Plot(LineArray(bars-Offset, tar3, BarCount, tar3,1), "", Clr, styleLine|styleDots, Null, Null, Offset);


buyach1 = IIf((Buy OR Long AND NOT Relax AND NOT Cover AND NOT Short AND NOT Shrt), H > tar1, 0);
buyach2 = IIf((Buy OR Long AND NOT Relax AND NOT Cover AND NOT Short AND NOT Shrt), H > tar2, 0);
buyach3 = IIf((Buy OR Long AND NOT Relax AND NOT Cover AND NOT Short AND NOT Shrt), H > tar3, 0);

sellach1 = IIf((Short OR Shrt AND NOT Relax AND NOT Sell AND NOT Buy AND NOT Long), L < tar1, 0);
sellach2 = IIf((Short OR Shrt AND NOT Relax AND NOT Sell AND NOT Buy AND NOT Long), L < tar2, 0);
sellach3 = IIf((Short OR Shrt AND NOT Relax AND NOT Sell AND NOT Buy AND NOT Long), L < tar3, 0);


// Message Board -----------------
GfxSelectFont( "Tahoma", 13, 100 );

GfxSetBkMode( 1 );

GfxSetTextColor
( colorWhite );

if ( SelectedValue( LastSignal ) == 1 )
    {
        GfxSelectSolidBrush( colordarkGreen );
    }
    else
    {
        GfxSelectSolidBrush( colorRed );
        }


pxHeight = Status( "pxchartheight" ) ;

xx = Status( "pxchartwidth");

Left = 1100;

width = 310;

x = 5;

x2 = 290;

y = pxHeight;

GfxSelectPen
( colorLightBlue, 1); // border color

GfxRoundRect
( x, y - 155, x2, y , 7, 7 ) ;


GfxTextOut( ( "Marketcalls - Supertrend V4.0"),13,y-130);

GfxTextOut
( ("" + WriteIf(Buy, "Go Long At "+C+" - SL " +Ref(TrendSL,-1),"")), 13, y-105);

GfxTextOut
( ("" + WriteIf (Short, "Go Short At "+C+" - SL " +Ref(TrendSL,-1),"")), 13, y-105);


GfxTextOut
( ("" + WriteIf (Sell AND NOT Short, "Exit Long At "+C,"")), 13, y-115);

GfxTextOut
( ("" + WriteIf (Cover AND NOT Buy, "Exit Short At "+C,"")), 13, y-115);


GfxTextOut
( ("" + WriteIf (Long AND NOT Buy, "Long At "+(BuyPrice)+" - TSL " + Ref(TrendSL,-1)+ "","")), 13, y-105);

GfxTextOut
( ("" + WriteIf (shrt AND NOT Short, "Short At "+(SellPrice)+" - TSL " + Ref(TrendSL,-1)+ "","")), 13, y-105);

GfxTextOut
( ("" + WriteIf (Relax, "No Trade Zone - Wait","")), 13, y-105);

GfxTextOut
( ("" + WriteIf (Long AND NOT Buy, "Current P/L: "+(C-BuyPrice)+" Points","")), 13, y-85);

GfxTextOut
( ("" + WriteIf (shrt AND NOT Short, "Current P/L: "+(ShortPrice-C)+" Points","")), 13, y-85);

GfxTextOut
( ("" + WriteIf (Long OR Buy OR Shrt OR Short, "Target 1: "+tar1,"")), 13, y-65);

GfxTextOut
( ("" + WriteIf (Long OR Buy OR Shrt OR Short, "Target 2: "+tar2,"")), 13, y-45);

GfxTextOut
( ("" + WriteIf (Long OR Buy OR Shrt OR Short, "Target 3: "+tar3,"")), 13, y-25);

GfxTextOut
( ("" + WriteIf (buyach1, "Target 1: "+tar1+" :: Achiecheved","")), 13, y-65);

GfxTextOut
( ("" + WriteIf (sellach1, "Target 1: "+tar1+" :: Achiecheved","")), 13, y-65);

GfxTextOut
( ("" + WriteIf (buyach2, "Target 2: "+tar2+" :: Achiecheved","")), 13, y-45);

GfxTextOut
( ("" + WriteIf (sellach2, "Target 2: "+tar2+" :: Achiecheved","")), 13, y-45);

GfxTextOut
( ("" + WriteIf (buyach3, "Target 3: "+tar3+" :: Achiecheved","")), 13, y-25);

GfxTextOut
( ("" + WriteIf (sellach3, "Target 3: "+tar3+" :: Achiecheved","")), 13, y-25);


Filter=Buy OR Short;
AddColumn( IIf( Buy, 66 , 83 ), "Signal", formatChar, colorDefault, IIf( Buy , colorGreen, colorRed ) );
AddColumn(Close,"Entry Price",1.4, colorDefault, IIf( Buy , colorGreen, colorRed ));
AddColumn(Ref(TrendSL,-1),"Stop Loss",1.4, colorDefault, IIf( Buy , colorGreen, colorRed ));
AddColumn(tar1,"Target 1",1.4, colorDefault, IIf( Buy , colorGreen, colorRed ));
AddColumn(tar2,"Target 2",1.4, colorDefault, IIf( Buy , colorGreen, colorRed ));
AddColumn(tar3,"Target 3",1.4, colorDefault, IIf( Buy , colorGreen, colorRed ));
AddColumn(Volume,"Volume",1.0, colorDefault, IIf ((Volume > 1.25 * EMA( Volume, 34 )),colorBlue,colorYellow));


// Calculate Equity Curve

eq = Equity( 1, 0 );

//////////////////////////////////////////////////
// Calculate the Last Five Trades Profit/Losses //
//////////////////////////////////////////////////

tradesback = 5;
Signum = Cum( Buy ) + Cum( Short );
Signumstart1 = LastValue( SigNum ) - ( tradesback - 1 );
Signumstart2 = LastValue( SigNum ) - ( tradesback - 2 );
Signumstart3 = LastValue( SigNum ) - ( tradesback - 3 );
Signumstart4 = LastValue( SigNum ) - ( tradesback - 4 );
Signumstart5 = LastValue( SigNum ) - ( tradesback - 5 );

bi = BarIndex();
bistart = ValueWhen( signum == signumstart1, bi );
bicond = bi >= bistart AND bi <= LastValue( bi );


SellPL = IIf( Sell AND bicond, C-buyprice, 0 );
CovPL = IIf( Cover AND bicond, ShortPrice - C,0 );

cumPL = SellPL + CovPL;

//Plot (SellPL,"Sell",colorGreen,styleHistogram,maskhistogram);
///Plot (CovPL,"Cover", colorRed,styleHistogram,maskhistogram);

lsince = lowestSince(Sell OR Cover, cumPL, 0);
hsince = highestSince(Sell OR cover, CumPL, 0);


vs= IIf(lsince==0,hsince,lsince);


PL1 = ValueWhen( signum == signumstart1 , vs,1 );
PL2 = ValueWhen( signum == signumstart2 , vs,1 );
PL3 = ValueWhen( signum == signumstart3 , vs,1 );
PL4 = ValueWhen( signum == signumstart4 , vs,1 );
PL5 = ValueWhen( signum == signumstart5,  vs ,1 );

//////////////////////////////////////////////////
//   Plot the Last Five Trades Profit/Losses    //
//////////////////////////////////////////////////


Title = EncodeColor(colorWhite)+ "Backtest Results  from www.marketcalls.in" + " - " +  Name() + " - " + EncodeColor(colorRed)+ Interval(2) + EncodeColor(colorWhite) +

 "  - " + Date() +" - "+"\n" +EncodeColor(colorRed) +"Op-"+O+"  "+"Hi-"+H+"  "+"Lo-"+L+"  "+

"Cl-"+C+"  "+ "Vol= "+ WriteVal(V)+"\n"+ EncodeColor(colorYellow)+ "\n\n\nLast 5 Trade Results\n" +
"\nTrade1= " + PL1
+"\n"+ "Trade2= " + PL2
+"\n"+ "Trade3= " + PL3
+"\n"+ "Trade4= " + PL4
+"\n"+ "Trade5= " + PL5;


//Magfied Market Price

FS=Param("Font Size",30,11,100,1);

GfxSelectFont("Times New Roman", FS, 700, True );

GfxSetBkMode( colorWhite );

GfxSetTextColor( ParamColor("Color",colorGreen) );

Hor=Param("Horizontal Position",940,1,1200,1);

Ver=Param("Vertical Position",12,1,830,1);

GfxTextOut(""+C, Hor , Ver );

YC=TimeFrameGetPrice("C",inDaily,-1);

DD=Prec(C-YC,2);

xx=Prec((DD/YC)*100,2);

GfxSelectFont("Times New Roman", 11, 700, True );

GfxSetBkMode( colorBlack );

GfxSetTextColor(ParamColor("Color",colorYellow) );

GfxTextOut(""+DD+"  ("+xx+"%)", Hor , Ver+45 );


_SECTION_END();

_SECTION_BEGIN("EMA1");
P = ParamField("Price field",-1);
Periods = Param("Periods", 200, 2, 300, 1, 10 );
Plot( EMA( P, Periods ), _DEFAULT_NAME(), ParamColor( "Color", colorCycle ), ParamStyle("Style") );
_SECTION_END();

_SECTION_BEGIN("Time Left");

RequestTimedRefresh( 1 );

TimeFrame = Interval();

SecNumber = GetSecondNum();

Newperiod = SecNumber % TimeFrame == 0;

SecsLeft = SecNumber - int( SecNumber / TimeFrame ) * TimeFrame;

SecsToGo = TimeFrame - SecsLeft;


x=Param("xposn",50,0,1000,1);

y=Param("yposn",380,0,1000,1);


GfxSelectSolidBrush( ColorRGB( 230, 230, 230 ) );

GfxSelectPen( ColorRGB( 230, 230, 230 ), 2 );

if ( NewPeriod )

{

GfxSelectSolidBrush( colorYellow );

GfxSelectPen( colorYellow, 2 );

Say( "New period" );

}

//GfxRoundRect( x+45, y+40, x-3, y-2, 0, 0 );

//GfxSetBkMode(1);

GfxSelectFont( "Arial", 14, 700, False );

GfxSetTextColor( colorRed );

GfxTextOut( "Time Left :"+SecsToGo+"", x, y );

_SECTION_END();
3 comments
Leave Comment
Please login here to leave a comment.
Back
Very Nice studies
This is the best and real strategy making profit. I am using with Auto trading . Giving best result as expected. This strategy best Only for trading on nifty and bank nifty. So why go in finding more and more indicator if one strategy is making good profit.
Thanks a lot marketcalls.
I have some error with your code . Can you leave your email to dicuss your code . My email is akihoakana@gmail.com . Thanks a lot