Stock Portfolio Organizer
The ultimate porfolio management solution.
Shares, Margin, CFD's, Futures and Forex
EOD and Realtime
Dividends and Trust Distributions
And Much More ....
WiseTrader Toolbox
#1 Selling Amibroker Plugin featuring:
Advanced Adaptive Indicators
Advanced Pattern Exploration
Neural Networks
And Much More ....
Live bar counting on chart. for Amibroker (AFL)
Rating:
5 / 5 (Votes 1)
Tags:
amibroker
This afl will help to know the number of bars in a (selected) range for a ‘up’, ‘down’ or ‘sideways’ trend or in other applications.
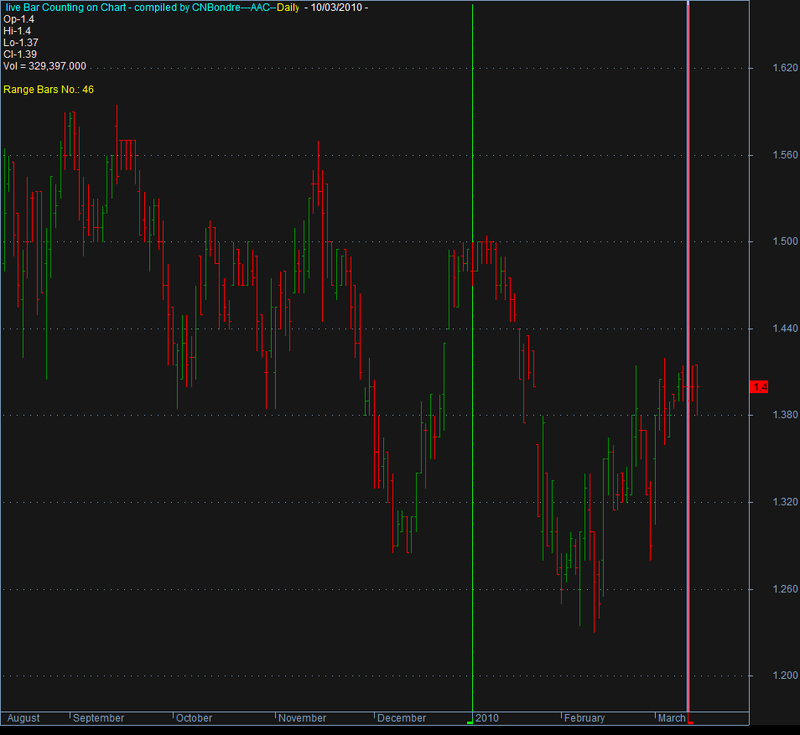
This is how the graph will look like.
Count between Red and Green line is displayed at the left top last line, ‘Range Bars No.’
Screenshots
Similar Indicators / Formulas
Kavach Of Karna v2
Submitted
by hbkwarez almost 10 years ago
Advanced Elliott Waves
Submitted
by MarcosEn over 12 years ago
3_6Day GuaiLiLv
Submitted
by motorfly over 12 years ago
Williams Alligator System
Submitted
by durgesh1712 over 12 years ago
Interactive Linear Regression Channel
Submitted
by InternetWorm over 12 years ago
*Level Breakout system*
Submitted
by Tinych over 12 years ago
Indicator / Formula
Copy & Paste Friendly
_SECTION_BEGIN("Live Bar Counting on Chart");
/* This is a active chart for counting BARs. You will get number of bars instantly between two bars (Range of selected Bars).
Simply select and double click on a Bar and then select another Bar and double click on it too.
You will get two beatiful verticle lines. The bar counting of selected range will be displayed at the left top.
This afl will help to know the number of bars in a (selected) range for a “upâ€, “down†or “sideways†trend or in other app;ications. To remove verticle lines double click on them.
*/
SetBarsRequired(100000,0);
GraphXSpace = 15;
SetChartOptions(0,chartShowArrows|chartShowDates);
Title = EncodeColor(colorCustom11)+" live Bar Counting on Chart - compiled by CNBondre" + "---" + Name()+ "--" + EncodeColor(colorYellow)+ Interval(2) + EncodeColor(colorWhite) +
" - " + Date() +" - " + EncodeColor(colorRose) +"\nOp-"+O+" "+"\nHi-"+H+" "+"\nLo-"+L+" "+
"\nCl-"+C+" "+ "\nVol = "+ WriteVal(V)+"\n" + EncodeColor(colorYellow);
// Background color
SetChartBkColor(ColorRGB(23,23,23));
// Display line chart for tick data automatically
priceStyle = IIf( (Interval(0) == -900), styleLine, styleBar);
// Quick counting of bars by range selector
if (BeginValue(BarIndex()) != 0 AND EndValue(BarIndex()) != BarCount-1) {
range = EndValue(BarIndex())-BeginValue(BarIndex());
Title += StrFormat("\nRange Bars No.: %g", range);
}
CandleBorder = ParamColor("Candle Border Color", colorBlack );
UpCandleColor = ParamColor("Up Candle Color", colorGreen );
DownCandleColor = ParamColor("Down Candle Color", colorRed );
// set amibroker to display colored bars
Graph0BarColor = IIf( C > O,UpCandleColor ,DownCandleColor);
Plot( C, "Close", CandleBorder, styleNoTitle | ParamStyle("Style") | priceStyle );
_SECTION_END();
3 comments
Leave Comment
Please login here to leave a comment.
Back
Dear,
Moderator,
Trying to load the png image created by this afl. Could not upload it. Is there any other method to upload it?
Regards,
cnbondre
Hi cnbondre, use Amibroker’s Edit → Export To File. That exports the correct image type so that it can be uploaded here.
tnx a lot.
very gooooooooooooood
i am happy