Stock Portfolio Organizer
The ultimate porfolio management solution.
Shares, Margin, CFD's, Futures and Forex
EOD and Realtime
Dividends and Trust Distributions
And Much More ....
WiseTrader Toolbox
#1 Selling Amibroker Plugin featuring:
Advanced Adaptive Indicators
Advanced Pattern Exploration
Neural Networks
And Much More ....
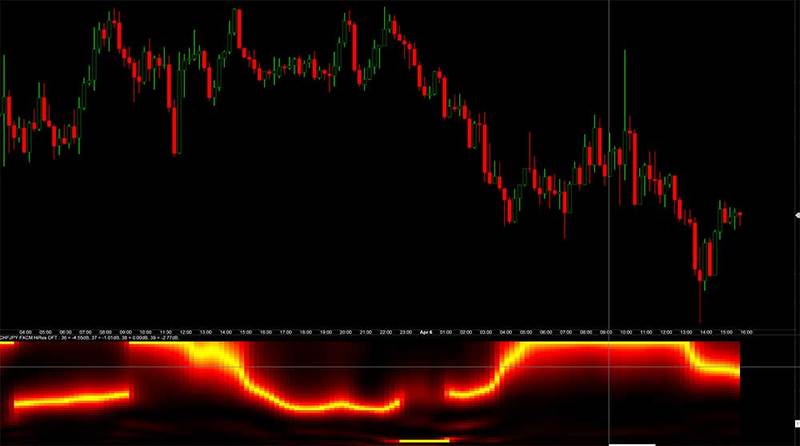
Fourier Transform for Amibroker (AFL)
Rating:
2 / 5 (Votes 3)
Tags:
amibroker
Good graphics to show dominant cycles – from John Ehlers work on trading cycles.
Screenshots
Indicator / Formula
Copy & Paste Friendly
PI = 3.1415926;
Data = (H+L)/2;
// detrending ( high-pass filter )
HFPeriods = Param("HP filter cutoff", 40, 20, 100 );
alpha1 = ( 1-sin(2*pi/HFPeriods) ) / cos( 2 * pi / HFPeriods );
HP = AMA2( Data - Ref( Data, -1 ), 0.5 * ( 1 + alpha1 ), alpha1 );
// 6-tap low-pass FIR filter
CleanedData = ( HP + 2 * Ref( HP, -1 ) + 3 * Ref( HP, -2 ) +
   3 * Ref( HP, -3 ) + 2 * Ref( HP, -4 ) + Ref( HP, -5 ) )/12;
// Discrete Fourier Transform
WindowSize = Param("Window Size", 50, 20, 100 );
Maxpwr = 0;
x = BarIndex();
for( period = 8; period <= WindowSize; period++ )
{
  tx = 2 * pi * x / period;
  cosinepart = Sum( CleanedData * cos( tx ), WindowSize );
  sinepart = Sum( CleanedData * sin( tx ), WindowSize );
  pwr = cosinepart ^ 2 + sinepart ^ 2;
  Maxpwr = Max( Maxpwr, pwr );
  VarSet( "pwr"+period, pwr );
}
// Normalize and convert to decibels
for( period = 8; period <= WindowSize; period++ )
{
  pwr = VarGet("pwr"+period);
  db = -10 * log10( 0.01 / ( 1 - 0.99 * pwr / Maxpwr ) );
  db = Min( db, 20 ); // 'saturate' at -20db
  VarSet( "db"+period, db );
}
Title = Name() + " HiRes DFT : ";
// Plot Heat Map ( Spectrogram )
// and find dominant cycle
DcNum = DcDenom = 0;
for( k = 8; k <= WindowSize; k++ )
{
  db = VarGet("db"+k);
  // convert dB to color
  Red = IIf( db > 10, 255 * ( 2 - db/10 ), 255 );
  Green = IIf( db <= 10, 255 * ( 1 - db/10 ), 0 );
  PlotOHLC( k, k, k-1, k-1, "",
            ColorRGB( Red, Green, 0 ), styleCloud | styleNoLabel);
  if( SelectedValue( db ) <= 5 )
      Title = Title + k + " = " + StrFormat("%.2lf",-db) + "dB, ";
  // dominant cycle calcs
  DcNum = DcNum + (db < 3 ) * k * ( 3 - db );
  DcDenom = DcDenom + ( db < 3 ) * ( 3 - db );
}
if( ParamToggle("Show Dom. Cycle?", "No|Yes" ) )
{
  DominantCycle = DcNum / DcDenom;
  Plot( DominantCycle, "Dominant Cycle", colorBlue );
  Title = Title + "{{VALUES}}";
}
GraphZOrder = 1;
0 comments
Leave Comment
Please login here to leave a comment.
Back