Stock Portfolio Organizer
The ultimate porfolio management solution.
Shares, Margin, CFD's, Futures and Forex
EOD and Realtime
Dividends and Trust Distributions
And Much More ....
WiseTrader Toolbox
#1 Selling Amibroker Plugin featuring:
Advanced Adaptive Indicators
Advanced Pattern Exploration
Neural Networks
And Much More ....
Smooth RSI and Stochastic with linear regression for Amibroker (AFL)
Rating:
3 / 5 (Votes 2)
Tags:
amibroker
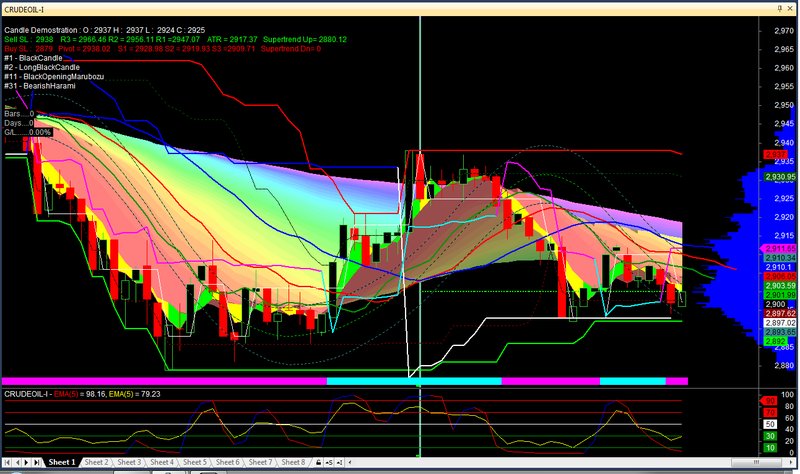
The indicator gives stochastic and rsi combinedly. Stocchastic is the yellow color line and RSI is the blue and red color line. Buy When the RSI is changing color from red to blue and sell when it is changing from blue to red. Oversold region is below 10 and overbought region is above 70.
Screenshots
Indicator / Formula
Copy & Paste Friendly
// Author Somanath Das @ somanath.das@gmail.com
// dated 22/04/2016 Mob. No. : 9337799507


_SECTION_BEGIN( "Small Triggers" );

p1 = Param( "TL 1 Periods", 5, 5, 50, 1 );
p2 = Param( "TL 2 Periods", 2, 3, 25, 1 );
TL1 = LinearReg( C, p1 );
TL2 = EMA( TL1, p2 );

Col1 = IIf( TL1 > TL2, ParamColor( "TL Up Colour1", colorblue ), ParamColor( "TL Dn Colour1", colorred ) );

TL3=RSIa(TL2,2);
TL4=EMA(StochK(5,2),2);


Plot(90,"",colorRed,styleLine);
Plot(70,"",colorRed,styleLine);
Plot(50,"",Colorwhite,styleLine);
Plot(30,"",colorGreen,styleLine);
Plot(10,"",colorGreen,styleLine);

Plot( TL3, "EMA(5)", Col1, styleLine|styleline | styleNoLabel ); // | styleThick
Plot( TL4, "EMA(5)", Coloryellow, styleLine|styleline | styleNoLabel ); // | styleThick


_SECTION_END();
2 comments
Leave Comment
Please login here to leave a comment.
Back
old trick to show , that he is having a new trading sytem……
The code what you posted is not match with the code. share all the code as per the graph.