Sentimental rsi for Amibroker (AFL)
palai777 over 9 years ago Amibroker (AFL)
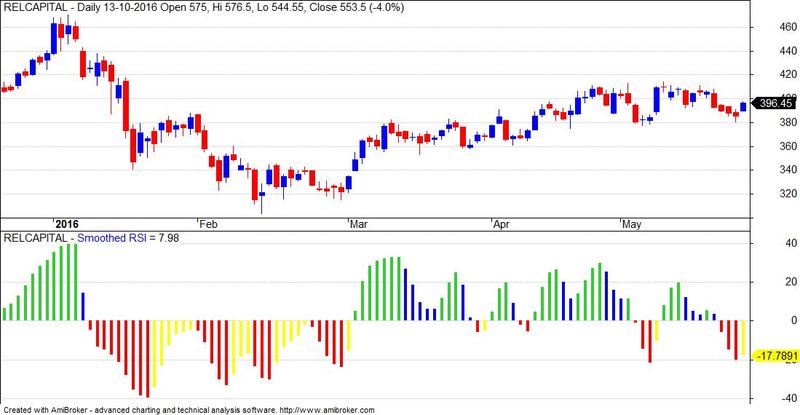
Just like any other indicator it has whipsaws but responsive and smooth compared to the traditional RSI where the noise factor reduces and helps you to focus on mean reversion trades.
The Color Transition from Red to Yellow indicates possible mean reversion from negative to positive trend
The Color Transition from Green to Blue indicates possible mean reversion from positive to negative trend
The Color Transition from Yellow to Green indicates possible positive trend continuation.
The Color Transition from Green to Blue indicates possible negative trend continuation.
Indicator suits to understand the underlying sentiment on the higher timeframes like 4h, Daily. Helps you to understand the underlying trend setup during your pre-trade analysis.
Screenshots
Indicator / Formula
source = (H+L+C)/3;
length = Param("Period",7,1,100,1);
hullma = wma(2*wma(source, length/2)-wma(source, length), round(sqrt(length)));
Hrsi = RSIa(hullma,length);
bcolor = iif( hrsi-50 > 0,
		iif( hrsi > nz(Ref(hrsi,-1)), colorlime, colorblue),
		iif( hrsi < nz(Ref(hrsi,-1)), colorred, coloryellow));
plot(hrsi-50,"Smoothed RSI", bcolor, styleHistogram,Null, Null,0,0,4 );
8 comments
Leave Comment
Please login here to leave a comment.
Kindly give due credits to the author. The person who has posted is not the author.
@rajenvyas if you know who the author is or have a link. Post it here in the comments.
Do not know if he is the author, R. Rajandran, but here is a link:
https://www.tradingview.com/script/bgPfrp1k-Sentimental-RSI-Marketcalls/
wery nice indicator
Excellent work.
REALLY GOOD
I edit to make chart look more visual and modified RSI resistance line, title color, background gradient color.
_SECTION_BEGIN(“Sentimental RSI”);
// Downloaded From https://www.WiseStockTrader.com
source = (H+L+C)/3;
length = Param(“Period”,7,1,200,1);
hullma = WMA-WMA, round(sqrt(length)));
Hrsi = RSIa(hullma,length);
supresval = Param(“RSI Sup-Res Line”,50); // Sup-Res Value
Histogram = Hrsi – supresval;
bcolor = IIf( Histogram > 0,
IIf( hrsi > Nz(Ref(hrsi,-1)), colorLime, colorBlue),
IIf( hrsi < Nz(Ref(hrsi,-1)), colorRed, colorYellow)
);
//Plot(hrsi-50,“Smoothed RSI”, bcolor, styleHistogram);
SetBarFillColor(bcolor);
PlotOHLC(0,Histogram,0,Histogram,EncodeColor(ParamColor(“Title Color”,colorBlue))“Sentimental RSI(”length+",“+supresval +”)",colorBlack, styleCandle |styleOwnScale) ;
_SECTION_END();
/// Backgound Gradient color
_SECTION_BEGIN(“Bkg Color”);
SetChartOptions(0,chartShowArrows|chartShowDates);
SetChartBkColor(ParamColor(“Outer panel”,colorWhite)); // color of outer border
SetChartBkGradientFill( ParamColor(“Inner panel upper”,colorDarkGrey),ParamColor(“Inner panel lower”,colorLightGrey));
_SECTION_END();
Any explorer, pls.