Stock Portfolio Organizer
The ultimate porfolio management solution.
Shares, Margin, CFD's, Futures and Forex
EOD and Realtime
Dividends and Trust Distributions
And Much More ....
WiseTrader Toolbox
#1 Selling Amibroker Plugin featuring:
Advanced Adaptive Indicators
Advanced Pattern Exploration
Neural Networks
And Much More ....
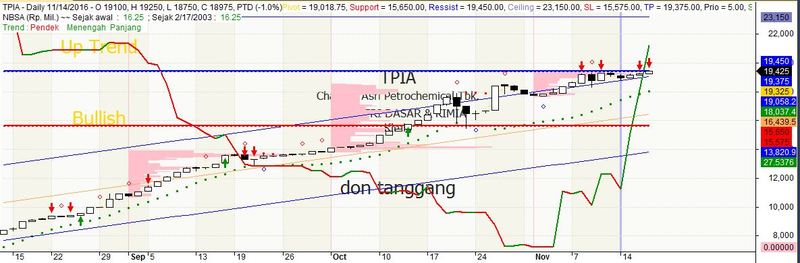
Don Tanggang for Amibroker (AFL)
Rating:
4 / 5 (Votes 7)
Tags:
fibonacci, oscillator, amibroker, exploration
An afl developed by myself, support and resistance are built from fibonacci level over the year, confirm buy and sell signal by using available data on the explorer.
The explorer will give you a lot of data.
Not for backtesting since it uses future reference, excellent to be used for day/position trader.
AFL using Indonesia stock rules for lot and capital determination, can be modified accordingly on the formula
Screenshots
Indicator / Formula
Copy & Paste Friendly
1 2 3 4 5 6 7 8 9 10 11 12 13 14 15 16 17 18 19 20 21 22 23 24 25 26 27 28 29 30 31 32 33 34 35 36 37 38 39 40 41 42 43 44 45 46 47 48 49 50 51 52 53 54 55 56 57 58 59 60 61 62 63 64 65 66 67 68 69 70 71 72 73 74 75 76 77 78 79 80 81 82 83 84 85 86 87 88 89 90 91 92 93 94 95 96 97 98 99 100 101 102 103 104 105 106 107 108 109 110 111 112 113 114 115 116 117 118 119 120 121 122 123 124 125 126 127 128 129 130 131 132 133 134 135 136 137 138 139 140 141 142 143 144 145 146 147 148 149 150 151 152 153 154 155 156 157 158 159 160 161 162 163 164 165 166 167 168 169 170 171 172 173 174 175 176 177 178 179 180 181 182 183 184 185 186 187 188 189 190 191 192 193 194 195 196 197 198 199 200 201 202 203 204 205 206 207 208 209 210 211 212 213 214 215 216 217 218 219 220 221 222 223 224 225 226 227 228 229 230 231 232 233 234 235 236 237 238 239 240 241 242 243 244 245 246 247 248 249 250 251 252 253 254 255 256 257 258 259 260 261 262 263 264 265 266 267 268 269 270 271 272 273 274 275 276 277 278 279 280 281 282 283 284 285 286 287 288 289 290 291 292 293 294 295 296 297 298 299 300 301 302 303 304 305 306 307 308 309 310 311 312 313 314 315 316 317 318 319 320 321 322 323 324 325 326 327 328 329 330 331 332 333 334 335 336 337 338 339 340 341 342 343 344 345 346 347 348 349 350 351 352 353 354 355 356 357 358 359 360 361 362 363 364 365 366 367 368 369 370 371 372 373 374 375 376 377 378 379 380 381 382 383 384 385 386 387 388 389 390 391 392 393 394 395 396 397 398 399 400 401 402 403 404 405 406 407 408 409 410 411 412 413 414 415 416 417 418 419 420 421 422 423 424 425 426 427 428 429 430 431 432 433 434 435 436 437 438 439 440 441 442 443 444 445 446 447 448 449 450 451 452 453 454 455 456 457 458 459 460 461 462 463 464 465 466 467 468 469 470 471 472 473 474 475 476 477 478 479 480 481 482 483 484 485 486 487 488 489 490 491 492 493 494 495 496 497 498 499 500 501 502 503 504 505 506 507 508 509 510 511 512 513 | //Created by don tanggang (c) 2016// InitC1 = C[0];//C2 = IIf(BarCount==1,C1,C[1]);//Sehari = ((C2/C1)-1)*100;//WriteVal (Sehari,1.1);//Kalkulasi momentumDC = IIf(IsEmpty(C[BarCount-5]),0,C[BarCount-1] - C[BarCount-5]);MAV = MA(V,5)/1000000;MMT = DC * MAV;MaxOpenPos = 5; SetOption("MaxOpenPositions", MaxOpenPos);PositionSize=-100/MaxOpenPos;Terakhir = ( ( C / C1 ) - 1 ) * 100;WriteVal( Terakhir, 1.1 );// Perhitungan pivot point, tidak boleh lebih besar dari open atau closePP = (O+H+L+C)/4; // Pivot pointPP = IIf(O == C, O, PP);PP = IIf (O> C AND PP > O, O, PP);PP = IIf (O> C AND PP < C, C, PP);PP = IIf (C> O AND PP > C, C, PP);PP = IIf (C> O AND PP < O, O, PP);_SECTION_BEGIN( "Profit/Loss % Change over Time" );// PARAMETERSTtD_Param = ParamList( "Period", "Day to Date|Week to Date|Month to Date|Year to Date", 0 );// VARIABLESFDayMonth = BarsSince( Month() != Ref( Month(), -1 ) );FDayYear = BarsSince( Year() != Ref( Year(), -1 ) );TtD_Period = IIf( TtD_Param == "Day to Date", 1, IIf( TtD_Param == "Week to Date", DayOfWeek(), IIf( TtD_Param == "Month to Date", FDayMonth, IIf( TtD_Param == "Year to Date", FDayYear, 0 ) ) ) );// FORMULATtD_Change = 100 * ( Close - Ref( Close, -TtD_Period ) ) / Ref( Close, -TtD_Period );_SECTION_END();_SECTION_BEGIN( "Price" );SetChartOptions( 0, chartShowArrows | chartShowDates );_N(Title = StrFormat("{{NAME}} - {{INTERVAL}} {{DATE}} Open %g, Hi %g, Lo %g, Close %g (%.1f%%) {{VALUES}}", O, H, L, C, SelectedValue( ROC( C, 1 ) ) ));Plot( C, "Close", ParamColor( "Color", colorBlack ), styleNoTitle | ParamStyle( "Style" ) | GetPriceStyle() );_SECTION_END();_SECTION_BEGIN( "Informasi Ticker" );GfxSetOverlayMode( 1 );SetChartBkColor( ParamColor( "Background Color", colorWhite ) );GfxSetTextColor( ParamColor( "Text Color", colorDarkGrey ) );GfxSetOverlayMode( 1 );Besar = Param( "Besar Font", 1, 0.3, 2, 0.1 );GfxSelectFont( "Tahoma", ( Status( "pxheight" ) / 20 )*Besar );GfxSetTextAlign( 6 );// center alignmentGfxSetBkMode( 0 ); // transparentGfxTextOut( Name(), Status( "pxwidth" ) / 2, Status( "pxheight" ) / 4 );GfxSelectFont( "Tahoma", ( Status( "pxheight" ) / 30 )*Besar );GfxTextOut( FullName(), Status( "pxwidth" ) / 2, Status( "pxheight" ) / 3 );GfxTextOut( GroupID( 1 ), Status( "pxwidth" ) / 2, Status( "pxheight" ) / 2.5 );GfxTextOut( IndustryID( 1 ), Status( "pxwidth" ) / 2, Status( "pxheight" ) / 2.2 );GfxSelectFont( "Tahoma", Status( "pxheight" ) / 18 );GfxTextOut( "don tanggang", Status( "pxwidth" ) / 2, Status( "pxheight" ) / 1.5 );_SECTION_END();_SECTION_BEGIN( "tick" );//Definisi fraksitick = IIf( C >= 5000, 25, IIf( C >= 2000, 10, IIf( C >= 500, 5, IIf( C >= 200, 2, 1 ) ) ) );_SECTION_END();_SECTION_BEGIN( "HHLL" );//Find highest and lowest over the yearsH1y = HHV( H, FDayYear );Hi = H1y[BarCount - 1];L1y = LLV( L, FDayYear );Lo = L1y[BarCount - 1];Hi = IIf( IsEmpty( Hi ), HHV( H, 22 ), Hi );Hi = IIf( IsEmpty( Hi ), HHV( H, 5 ), Hi );Lo = IIf( IsEmpty( Lo ), LLV( L, 22 ), Lo );Lo = IIf( IsEmpty( Lo ), LLV( L, 5 ), Lo );_SECTION_END();_SECTION_BEGIN( "Fibo" );/*Definisi tiap layer S/RBot - S1 - S2 - S3 - S4 - S5 - TopS 100 - 76.4 61.8 - S 50.0 - S 38.2 - S 23.6 - S0Prio 0 - 1 - 2 - 3 - 4 - 5 - 10*/DS = Hi - Lo;Bot = Lo;Top = Hi;S1 = Bot + ( 0.236 * DS );S2 = Bot + ( 0.382 * DS );S3 = Bot + ( 0.500 * DS );S4 = Bot + ( 0.618 * DS );S5 = Bot + ( 0.764 * DS );ext = Top + ( 0.236 * DS );ex2 = Top + ( 0.382 * DS );_SECTION_END();_SECTION_BEGIN( "Determination of Support, Resistance and Priority" );Sup = IIf( C >= Top, Top, IIf( C >= S5, S5, IIf( C >= S4, S4, IIf( C >= S3, S3, IIf( C >= S2, S2, IIf( C >= S1, S1, IIf( C >= Bot, Bot, Bot ) ) ) ) ) ) );Res = IIf( C >= Top, ext, IIf( C >= S5, Top, IIf( C >= S4, S5, IIf( C >= S3, S4, IIf( C >= S2, S3, IIf( C >= S1, S2, IIf( C >= Bot, S1, S1 ) ) ) ) ) ) );Cel = IIf( C >= Top, ex2, IIf( C >= S5, ext, IIf( C >= S4, Top, IIf( C >= S3, S5, IIf( C >= S2, S4, IIf( C >= S1, S3, IIf( C >= Bot, S2, S1 ) ) ) ) ) ) );Prio = IIf( C >= Top, 10, IIf( C >= S5, 5, IIf( C >= S4, 4, IIf( C >= S3, 3, IIf( C >= S2, 2, IIf( C >= S1, 1, IIf( C >= Bot, 0, 0 ) ) ) ) ) ) );//Check break out / break down dari supportSup = Sup - ( Sup % tick );Res = Res - ( Res % tick );Cel = Cel - ( Cel % tick );BO = IIf( C > Sup AND O < Sup, 1, -1 );BD = IIf( C< Res AND O > Res, 1, -1 );Cel = Cel - ( 3 * tick );SL = Sup - ( 3 * tick );TP = Res - ( 3 * tick );////Created by don tanggang (c) 2016//Plot Support,Ressistance, SL & TPPlot( PP, "Pivot", colorGold, styleDashed);Plot( Sup[Barcount - 1], "Support", colorRed, styleLine | styleThick );Plot( Res[Barcount - 1], "Ressist", colorBlue, styleLine | styleThick );Plot( Cel[Barcount - 1], "Ceiling", colorBlueGrey, styleLine | styleThick );Plot( SL[Barcount - 1], "SL", colorRed, styleDashed );Plot( TP[Barcount - 1], "TP", colorBlue, styleDashed );Plot( Prio[Barcount - 1], "Prio", colorBlack, styleNoDraw | styleOwnScale );_SECTION_END();_SECTION_BEGIN( "Value" );// Indikator Value dalam Milyar RupiahAvgPrice = ( O + H + L + C ) / 4;DV = AvgPrice * V;DVMil = DV / 1000000000;MADV20 = MA( DV, 20 );MADV20Mil = MADV20 / 1000000000;FV = DVMil / Ref( MADV20Mil, -1 ) ;_SECTION_END();_SECTION_BEGIN( "N B S A" );/* Hanya dipakai kalau langganan data NBSA// Akumulasi NBSA sejak awalNBSAValue_Cum = Cum( Aux2 ) / 1000000000 ;// Menghitung akumulasi NBSA sejak BEGIN VALUETglAwal = BeginValue( DateTime() );Bar = BarsSince( Datetime() == TglAwal );NBSAValue_Sum = Sum( Aux2, Bar ) / 1000000000;warna = IIf( NBSAValue_Cum > Ref( NBSAValue_Cum, -1 ), colorGreen, colorRed );PlotNBSA = ParamToggle( "Plot NBSA?", "Tidak|Ya", 1 );if( PlotNBSA ){ Plot( NBSAValue_Cum, " " , warna , styleLine | styleThick | styleLeftAxisScale | styleOwnScale | stylenotitle ); Title = Title + EncodeColor( colorblack ) + "\nNBSA (Rp. Mil.) ~~ Sejak awal : " + EncodeColor( colorred ) + WriteIf( NBSAValue_Cum < 0, WriteVal( NBSAValue_Cum, 1.2 ) , " " ) + EncodeColor( colorGreen ) + WriteIf( NBSAValue_Cum >= 0, WriteVal( NBSAValue_Cum, 1.2 ) , " " ); Title = Title + EncodeColor( colorblack ) + " ; Sejak " + DateTimeToStr( TglAwal ) + " : " + EncodeColor( colorred ) + WriteIf( NBSAValue_Sum < 0, WriteVal( NBSAValue_Sum, 1.2 ) , " " ) + EncodeColor( colorGreen ) + WriteIf( NBSAValue_Sum >= 0, WriteVal( NBSAValue_Sum, 1.2 ) , " " );// Buat pita NBSA Cummulation MA5 = MA( NBSAValue_Cum, 5 ); MA20 = MA( NBSAValue_Cum, 20 ); NCum = NBSAValue_Cum ;//Definisi Kuning = ( NCum > MA5 ); Hijau = ( NCum > MA5 ) AND( NCum > MA20 ) ; Merah = ( NCum < MA5 ) AND( NCum < MA20 ) ; ZoneColorNBSA = IIf( Hijau, colorGreen, IIf( Kuning, colorYellow, IIf( Merah, colorRed, 0 ) ) ); PlotZoneNBSA = ParamToggle( "Plot Pita NBSA?", "Tidak|Ya", 0 ); if( PlotZoneNBSA ) Plot( 2, "Zone NBSA", ZonecolorNBSA , styleOwnScale | styleArea | styleNoTitle, -0.5, 100 );}_SECTION_END();*/// REVERSAL by Candlestick_SECTION_BEGIN( "Candle Reversal" );PlotReversal = ParamToggle( "Tampilkan Sinyal Candle Reversal ?", "Tidak|Ya", 1 );if( PlotReversal ){ C1 = Ref( C, -1 ); C2 = Ref( C, -2 ); A1 = Ref( Avg, -1 ); A2 = Ref( Avg, -2 ); A3 = Ref( Avg, -3 ); A4 = Ref( Avg, -4 ); A5 = Ref( Avg, -5 ); O1 = Ref( O, -1 ); O2 = Ref( O, -2 ); Syarat1 = ( ( A1 < A2 ) AND( A2 < A3 ) AND( A1 < A4 ) ); //AND (A3 < A4) ) ;//OR ( A1 < A3); Syarat2 = ( C1 <= O1 ) AND( C2 <= O2 ); SyaratTurun = Syarat1 AND Syarat2; Syarat3 = ( A1 > A2 ) AND( A2 > A3 ) AND( A1 > A4 ) ; Syarat4 = ( C1 >= O1 ) AND( C2 >= O2 ); SyaratNaik = Syarat3 AND Syarat4; DibawahMA20 = C < MA( C, 20 ); DiatasMA20 = C > MA( C, 20 );//HammerItem = BodyI = O - C; TailI = C - L; HammerItem = ( O == H ) AND( C < O ) AND( TailI >= 2 * BodyI );//HammerPutih = BodyP = C - O; TailP = O - L; HammerPutih = ( C == H ) AND( C > O ) AND( TailP >= 2 * BodyP ); Hammer = HammerPutih OR HammerItem;// Syarat Candlestick Bullish dan Bearish Reversal Doji = O == C; BodiPutih = C > O ;//AND (TailI < BodyI) ; BodiItem = C < O ;//AND (TailP < BodyP); BullishReversal = Doji OR BodiPutih OR Hammer; BearishReversal = Doji OR BodiItem OR Hammer; SyaratBullishR = SyaratTurun AND BullishReversal ; SyaratBearishR = SyaratNaik AND BearishReversal ; PlotShapes( IIf( SyaratBullishR , shapeHollowSmallCircle, shapeNone ), colorBlue, 0, L, -15 ); PlotShapes( IIf( SyaratBearishR , shapeHollowSmallCircle, shapeNone ), colorRed, 0, H, 15 );}_SECTION_END();// Trend - MA_SECTION_BEGIN( "T r e n d" );DTPendek = C <= MA( C, 5 );DTMenengah = C <= MA( C, 20 ) ;DTPanjang = C <= MA( C, 50 ) ;UTPendek = C >= MA( C, 5 );UTMenengah = C >= MA( C, 20 ) ;UTPanjang = C >= MA( C, 50 ) ;PlotTrend = ParamToggle( "Tampilkan Trend ?", "Tidak|Ya", 1 );if( PlotTrend ){ Title = Title + "\nTrend : "; Title = Title + WriteIf( DTPendek, EncodeColor( colorred ) + "Pendek ", WriteIf( UTPendek, EncodeColor( colorgreen ) + "Pendek ", "" ) ); Title = Title + WriteIf( DTMenengah, EncodeColor( colorred ) + "Menengah ", WriteIf( UTMenengah, EncodeColor( colorgreen ) + "Menengah ", "" ) ); Title = Title + WriteIf( DTPanjang, EncodeColor( colorred ) + "Panjang ", WriteIf( UTPanjang, EncodeColor( colorgreen ) + "Panjang ", "" ) );}_SECTION_END();_SECTION_BEGIN( "Engulfing_Star" );BullEn = IIf( ( C > Ref( O, -1 ) ) AND( O < Ref( C, -1 ) ) AND( Ref( C, -1 ) < Ref( O, -1 ) ) AND( C > O ), 1, 0 );BearEn = IIf( ( C < Ref( O, -1 ) ) AND( O > Ref( C, -1 ) ) AND( Ref( C, -1 ) > Ref( O, -1 ) ) AND( O > C ), 1, 0 );MS = IIf( ( Ref( O, -2 ) > Ref( C, -2 ) ) AND( Ref( O, -1 ) < Ref( O, -1 ) ) AND( O < C ) AND( Ref( C, -1 ) < Ref( C, -2 ) ) AND( Ref( C, -1 ) < O ), 1, 0 );ES = IIf( ( Ref( O, -2 ) < Ref( C, -2 ) ) AND( Ref( O, -1 ) > Ref( O, -1 ) ) AND( O > C ) AND( Ref( C, -1 ) > Ref( C, -2 ) ) AND( Ref( C, -1 ) > O ), 1, 0 );_SECTION_END();_SECTION_BEGIN( "Regresi Linear" );// Parameter-parameterFDY = BarsSince( Year() != Ref( Year(), -1 ) );Perioda = Param( "Perioda", 182, 2, 300, 1 );Geser = Param( "Perioda mundur ", 0, 0, 300, 1 );P = ParamField( "Price field", -1 );// Menghitung Regresi Linear (RL)x = Cum( 1 );lastx = LastValue( x ) - Geser ; // menentukan akhir dari RLaa = LastValue( Ref( LinRegIntercept( P, Perioda ), -Geser ) );bb = LastValue( Ref( LinRegSlope( P, Perioda ), -Geser ) );// Persamaan Garis Regresi Lineary = aa + bb * ( x - ( Lastx - Perioda + 1 ) );slope = IIf( y > Ref( y, -1 ), 1, -1 );// Menampilkan Regresi LinearLRColor = ParamColor( "LR Color", colorCycle );LRLine = IIf( x > ( lastx - Perioda ) AND BarIndex() < Lastx, y, Null );Plot( LRLine , "Regresi Linear", LRCOLOR, style = styleNotitle ); //LRSTYLE);_SECTION_END();// ========================== Plot Channel Deviasi Standard =====================================================_SECTION_BEGIN( "Deviasi Standar" );// Parameter Deviasi StandarDSP = Param( "Deviasi Standar", 1.0, 0, 6, 0.1 );DS = DSP / 2;// Menghitung Channel Deviasi Standarwidth = LastValue( Ref( DS*StDev( p, Perioda ), -Geser ) );DSU = IIf( x > ( lastx - Perioda ) AND BarIndex() < Lastx, y + width , Null ) ;DSL = IIf( x > ( lastx - Perioda ) AND BarIndex() < Lastx, y - width , Null ) ;CDSL = ((C - DSL)/C) * 100;DSColor = ParamColor( "Warna DS ", colorCycle );// Menampilkan Channel Atas dan BawahPlot( DSU , "Top Channel ", DSColor, style = styleNoTitle ); //DSStyle );Plot( DSL , "Btm Channel ", DSColor, style = styleNoTitle ); // DSStyle );_SECTION_END();// Perhitungan SAR_SECTION_BEGIN( "SAR" );acc = Param( "Acceleration", 0.02, 0, 1, 0.001 );accm = Param( "Max. acceleration", 0.2, 0, 1, 0.001 );SI = IIf( SAR( acc, accm ) < C, 1, 0 ); // SAR IndicatorPlot( SAR( acc, accm ), _DEFAULT_NAME(), IIf( SI == 1, colorGreen, colorRed ), ParamStyle( "Style", styleDots | styleNoLine, maskDefault | styleDots | styleNoLine ) );_SECTION_END();_SECTION_BEGIN( "VAP" );segments = IIf( Interval() < inDaily, Day(), Month() );segments = segments != Ref( segments , -1 );PlotVAPOverlayA( segments , Param( "Lines", 300, 100, 1000, 1 ), Param( "Width", 80, 1, 100, 1 ), ParamColor( "Color", colorPink ), ParamToggle( "Side", "Left|Right" ) | 2 * ParamToggle( "Style", "Fill|Lines", 0 ) | 4 * ParamToggle( "Z-order", "On top|Behind", 1 ) );Plot( segments, "", colorPink, styleHistogram | styleOwnScale );_SECTION_END();_SECTION_BEGIN( "R" );R2PDS = 20;R2 = Correlation( Cum( 1 ), C, r2pds ) * Correlation( Cum( 1 ), C, r2pds );slopeR = LinRegSlope( C, r2pds );Crit = IIf( R2PDS == 5, .77, IIf( R2PDS == 10, .40, IIf( R2PDS == 14, .27, IIf( R2PDS == 20, .20, IIf( R2PDS == 25, .16, IIf( R2PDS == 30, .13, IIf( R2PDS == 50, .08, IIf( R2PDS == 60, .06, IIf( R2PDS == 120, .03, 0 ) ) ) ) ) ) ) ) );_SECTION_END();_SECTION_BEGIN( "MACD" );//Calc MACDMGC = Cross( MACD( 12, 26 ), signal( 12, 26, 9 ) );MDC = Cross( signal( 12, 26, 9 ), MACD( 12, 26 ) );MP = iif( MACD( 12, 26 ) > 0, 1, 0 );CMA50 = Cross( C, MA( C, 50 ) );GMA50 = IIf( C > MA( C, 50 ), 1, 0 );_SECTION_END();/*hanya dipakai untuk langganan data frekuensi_SECTION_BEGIN( "Frekuensi" );PlotFreks = ParamToggle( "Plot FREKUENSI?", "Tidak|Ya", 0 );Frek = ( Volume / ( ( Aux1 ) ^ 3 ) ) * 100;Freks = IIf( Aux1 != 0, Frek, 1 );MA20 = MA( Freks, 20 );WarnaFreks = IIf( Freks > MA20 AND C > O AND C > Ref( C, -1 ), colorBlue, colorlightGrey );if( PlotFreks ) Plot( Freks, " ; Vol/Frek^3 ", WarnaFreks, styleHistogram | styleOwnScale | styleNoTitle );_SECTION_END();*///Display Trend and breakGfxSetTextColor( ParamColor( "Text Color", colorGold ) );GfxTextOut( WriteIf( slope == 1, "Up Trend", "Down Trend" ), Status( "pxwidth" ) / 8, Status( "pxheight" ) / 8 );GfxTextOut( WriteIf( BO == 1, "Break Out", WriteIf( BD == 1, "Break Down", "" ) ), Status( "pxwidth" ) / 8, Status( "pxheight" ) / 5 );GfxTextOut( WriteIf( MGC == 1, "MACD Golden Cross", WriteIf( BD == 1, "MACD Death Cross", "" ) ), Status( "pxwidth" ) / 6, Status( "pxheight" ) / 3.5 );GfxSetTextColor( ParamColor( "Text Color", colorGrey50 ) );GfxTextOut( WriteIf( CMA50 == 1, "Cross Up MA50", WriteIf( GMA50 == 1, "Bullish", "" ) ), Status( "pxwidth" ) / 8, Status( "pxheight" ) / 2.5 );//_SECTION_BEGIN( "Kalkulasi" );naik = IIf( C > O, 1, 0 );PG = ( ( TP - C ) / C ) * 100;PL = ( ( C - SL ) / C ) * 100;RRR = PG / PL;PG2 = ( ( Cel - C ) / C ) * 100;RR2 = PG2 / PL;//Kalkulasi momentumDC = IIf(IsEmpty(C[BarCount-5]),0,C[BarCount-1] - C[BarCount-5]);MAV = MA(V,5)/1000000;MMT = DC * MAV;//InvestingIV = MA( C * V, 100 );IV = IIf( IsEmpty( IV ), MA( C * V, 22 ), IV );IV = IIf( IsEmpty( IV ), MA( C * V, 5 ), IV );IVD = IV / 5000000000;MFIz = Ref( ( ( H - L ) / V ), -1 ); // MFI kemarinMFIa = ( H - L ) / V; // MFI sekarangVz = Ref( V, -1 );indi = IIf( V > Vz, IIf( MFIa > MFIz, 1, 4 ), IIf( MFIa > MFIz, 3, 2 ) );//Hitung kekuatan trend berdasarkan jumlah indikator yang OKKuat = slope + IIf( indi == 1 OR indi == 4, 1, 0 ) + IIf( MP == 1 AND MDC == 0, 1, 0 ) + IIf( CMA50 == 1, 0, GMA50 ) + CMA50 + SI + BullEn - BearEn + IIf( slopeR >= 0, 1, -1 );PositionScore=MMT;_SECTION_END();_SECTION_BEGIN( "Explorer" );Buy = PL <= 1 OR BO == 1; // AND naik == 1;Sell = PG <= 1 OR BD == 1; // AND naik == 0;None = PL > 1 AND PG > 1;konfirm = IIf(Sell, C < TP, C > Sup);// Menampilkan penanda beli atau jualPlotShapes( Buy * shapeUpArrow + Sell * shapeDownArrow, IIf( Buy, colorGreen, colorRed ) );// FILTERFilter = MADV20Mil >= 5;////////////////////////////////////EXPLORER////////////////////////////////////Plot explorerAddTextColumn( WriteIf( Buy, "Beli", WriteIf( Sell, "Jual", "Hold" ) ), "Sinyal", 1.0 );AddColumn( konfirm, "C?", format = 1.0 );AddColumn( C, "Close", format = 1.0, IIf( C > O, colorGreen, colorRed ) );AddColumn( PP, "Pivot", format = 1.0, IIf( C > O, colorGreen, colorRed ) );AddColumn( ROC( C, 1 ), "D%", 1.2, IIf( ROC( C, 1 ), colorGreen, colorRed ) );//AddColumn( Sup, "Sup", format = 1.0 );AddColumn( SL, "SL", format = 1.0 );AddColumn( Cel, "TP", format = 1.0 );AddColumn( Res, "Res", format = 1.0 );AddColumn( Res-TP, "DRes", format = 1.0 );//AddColumn( TP, "TP", format = 1.0 );AddColumn( PG, "PG", format = 1.2 );AddColumn( PL, "PL", format = 1.2 );AddColumn( RRR, "RRR", format = 1.2 );AddColumn( RR2, "RR2", format = 1.2 );AddColumn( MMT, "MMT", format = 1.0 );//Priority ranking & Risk Reward RatioAddColumn( Prio, "Rank", format = 1.0 );AddColumn( Kuat, "STR", format = 1.0 );AddColumn( IVD, "IVD", format = 1.1 );AddTextColumn( Writeif( slope == 1, "UpTrend", "DnTrend" ), "Trend", format = 1.0, IIf( slope == 1, colorGreen, colorRed ) );AddColumn( slopeR, "SlpR", format = 1.2 );AddColumn( IIf( BO == 1, 1, IIf( BD == 1, -1, 0 ) ), "BSR", format = 1.0 );AddTextColumn( WriteIf( indi == 1, "Green", writeIf( indi == 2, "Fade", writeIf( indi == 3, "Fake", "Squat" ) ) ), "MFI", format = 1.0, IIf( indi == 1, colorGreen, IIf( indi == 2, colorRed, IIf( indi == 3, colorBlue, colorPink ) ) ) );/*MFI signaL :1 = Green2 = Fade / Red3 = Fake / Blue4 = Squat / Pink*/AddTextColumn( WriteIf( MP == 0, "Bear", WriteIf( MGC == 1, "GoldenCross", WriteIf( MDC == 1, "DeathCross", "Bull" ) ) ), "MACD", format = 1.0, IIf( MP == 0 OR MDC == 1, colorAqua, colorGold ) );AddTextColumn( WriteIf( GMA50 == 0, "Bear", WriteIf( CMA50 == 1, "Cross", "Bull" ) ), "MA50", format = 1.0, IIf( GMA50 == 0, colorAqua, colorGold ) );AddTextColumn( WriteIf( SI == 1, "Bull", "Bear" ), "SAR", format = 1.0, IIf( SI == 0, colorAqua, colorGold ) );AddTextColumn( Writeif( BullEn == 1, "Bullish", WriteIf( BearEn == 1, "Bearish", "" ) ), "Engulf", format = 1.0, IIf( BullEn == 1, colorGreen, colorRed ) );AddTextColumn( Writeif( MS == 1, "Morning", WriteIf( ES == 1, "Evening", "" ) ), "Star", format = 1.0, IIf( MS == 1, colorGreen, colorRed ) );AddColumn( Fv, "TVx", format = 1.1 );AddColumn( ( C - MA( C, 50 ) ) / MA( C, 50 ), "DMA50", format = 1.2, colorBrightGreen );AddColumn( ( C - MA( C, 100 ) ) / MA( C, 100 ), "DMA100", format = 1.2, colorBlueGrey );MA5y = MA( C, 1251 );CMA5y = ( ( C - MA5y ) / MA5y ) * 100;AddColumn( CMA5y, "CMA5y", format = 1.2 );AddColumn( CDSL, "CDSL", format = 1.2 );AddColumn(Bot,"Bot",format=1.0);AddColumn(S1,"S1",format=1.0);AddColumn(S2,"S2",format=1.0);AddColumn(S3,"S3",format=1.0);AddColumn(S4,"S4",format=1.0);AddColumn(S5,"S5",format=1.0);AddColumn(Top,"Top",format=1.0);AddColumn(ext,"Ext",format=1.0);AddColumn(ex2,"Ex2",format=1.0);AddColumn(FDayYear,"FDY",format=1.0);_SECTION_END(); |
9 comments
Leave Comment
Please login here to leave a comment.
Back
yes, as you said, signal repaints hence the back test results are not reliable. But, however, excellent work. For me, it needed slight correction to make it work for scan and explorer.
Error on line 47
N( Title = StrFormat( “{{NAME}} – {{INTERVAL}} {{DATE}} – O g, H %g, L %g, C %g, PTD (.1f%%){{VALUES}}”, O, H, L, C,
SelectedValue( ROC ), SelectedValue( TtDChange ) ) );
@acchiang what version are you using, I’m using amibroker V6 and no error. Could you clarify complete error message?
PTDremove one of the percent signs
PlotVAPOverlayA( segments , Param( “Lines”, 300, 100, 1000, 1 ), Param( “Width”, 80, 1, 100, 1 ), ParamColor( “Color”, colorPink ), ParamToggle( “Side”, “Left|Right” ) | 2 * ParamToggle( “Style”, “Fill|Lines”, 0 ) | 4 * ParamToggle( "Z-orde
error in line 360 on ami 5
help me please…
error in line 51
Error 61. The number of format specifier(s) (%) does not match the number of arguments passed.
i used amibroker 6.20.1
thanks
I have fixed the bug.
Dear admin, need your help with that error in exploration
Error 10. Array subscript out of range. You must not access array element out side 0
It looks like you don’t have enough bars of data thus the error.