Stock Portfolio Organizer
The ultimate porfolio management solution.
WiseTrader Toolbox
#1 Selling Amibroker Plugin featuring:
Distinct MACD Exploration for Amibroker (AFL)
MACD is a good indicator, specially for the new traders who have not built their discipline yet. Among the lagging indicators, I like MACD more than the others. MACD is a good indicators specially for those who suffer from entering and exiting too early.
MACD forms some special and strong trade setups. MACD Divergence and Convergence are two of the strong chart patterns that MACD forms. They are very easy to locate on the charts.
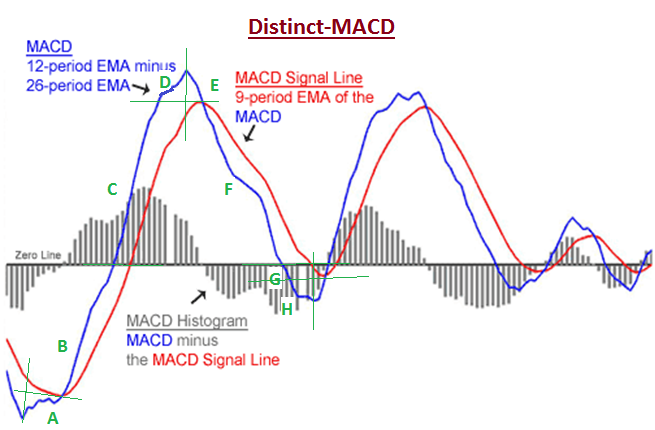
I use the MACD histogram. The MACD traditional indicator has two parts. The first part consists of two lines. One of the lines is the MACD indicator itself and the other line is the moving average of this indicator. The second part is the MACD Histogram which is calculated based on the distance of the two lines. Using the histogram makes the indicator simpler, and it still reflects the signals we need to trade. So I remove the lines and I only keep the histogram. The MACD default settings is 12, 26, 9.
Here i have given afl code for Distinct MACD Exploration to easily classify each category of MACD signals as provided picture.
Screenshots
Indicator / Formula
///////////////////////////////////////////////////////////////////////////////////////////////////////////////////////////////////////////////////////////////////////
/////////////////////*******************************  Distinct-MACD ******************************************************************************/////////////////////
///////////////////////////////////////////////////////////////////////////////////////////////////////////////////////////////////////////////////////////////////////

TimeFrameSet( inWeekly );

_SECTION_BEGIN("Distinct MACD");

r11 = 12;
r22 = 26;
r33 = 9;

r1 = Optimize( "Fast avg", r11, 2, 200, 1 );
r2 = Optimize( "Slow avg", r22 , 2, 200, 1 );
r3 = Optimize( "Signal avg", r33 , 2, 200, 1 );

ml = MACD(r1, r2);
sl = Signal(r1,r2,r3);
hl =ml-sl;

Plot( ml = MACD(r1, r2), StrFormat(_SECTION_NAME()+"(%g,%g)", r1, r2), ParamColor("MACD color", colorRed ), ParamStyle("MACD style"));
Plot( sl = Signal(r1,r2,r3), "Signal" + _PARAM_VALUES(), ParamColor("Signal color", colorBlue ), ParamStyle("Signal style") );
Plot( ml-sl, "MACD Histogram", IIf( ml - sl > 0, colorBlue, colorRed ), styleNoTitle | ParamStyle("Histogram style", styleHistogram | styleNoLabel, maskHistogram ) );

Catagory_A =
(ml <=0
AND sl <=0
AND hl <=0
AND ml >= Ref(ml, -1)
AND hl >= Ref(hl, -1)
AND ml < sl);

Catagory_B =
(ml <=0
AND sl <=0
AND hl > 0
AND ml >= Ref(ml, -1)
AND sl >= Ref(sl, -1)
AND hl >= Ref(hl, -1)
AND ml >= sl);

Catagory_C =
(ml > 0
AND sl > 0
AND hl > 0
AND ml >= Ref(ml, -1)
AND sl >= Ref(sl, -1)
AND hl >= Ref(hl, -1)
AND ml >= sl);

Catagory_D =
(ml > 0
AND sl > 0
AND hl > 0
AND ml >= Ref(ml, -1)
AND hl < Ref(hl, -1)
AND ml >= sl);

Catagory_E =
(ml > 0
AND sl > 0
AND hl > 0
AND ml < Ref(ml, -1)
AND hl < Ref(hl, -1)
AND ml >= sl);


Catagory_F =
(ml > 0
AND sl > 0
AND hl <= 0
AND ml < Ref(ml, -1)
AND sl < Ref(sl, -1)
AND hl < Ref(hl, -1)
AND ml < sl);


Catagory_G =
(ml <= 0
AND sl <= 0
AND hl <= 0
AND ml < Ref(ml, -1)
AND sl < Ref(sl, -1)
AND hl < Ref(hl, -1)
AND ml < sl);

Catagory_H =
(ml <= 0
AND sl <= 0
AND hl <= 0
AND ml < Ref(ml, -1)
AND hl >= Ref(hl, -1)
AND ml < sl);


Filter =1;

AddTextColumn(WriteIf(Catagory_A >0,"1",""), "Catagory_A", 70, colorDefault, IIf(Catagory_A >0,colorOrange, colorDefault));
AddTextColumn(WriteIf(Catagory_B >0,"2",""), "Catagory_B", 70, colorDefault, IIf(Catagory_B >0,colorBrightgreen, colorDefault));
AddTextColumn(WriteIf(Catagory_C >0,"3",""), "Catagory_C", 70, colorDefault, IIf(Catagory_C >0,colorgreen, colorDefault));
AddTextColumn(WriteIf(Catagory_D >0,"4",""), "Catagory_D", 70, colorDefault, IIf(Catagory_D >0,colorDarkgreen, colorDefault));
AddTextColumn(WriteIf(Catagory_E >0,"5",""), "Catagory_E", 70, colorDefault, IIf(Catagory_E >0,colorBlue, colorDefault));
AddTextColumn(WriteIf(Catagory_F >0,"6",""), "Catagory_F", 70, colorDefault, IIf(Catagory_F >0,colorDarkblue, colorDefault));
AddTextColumn(WriteIf(Catagory_G >0,"7",""), "Catagory_G", 70, colorDefault, IIf(Catagory_G >0,colorDarkRed, colorDefault));
AddTextColumn(WriteIf(Catagory_H >0,"8",""), "Catagory_H", 70, colorDefault, IIf(Catagory_H >0,colorRed, colorDefault));

_SECTION_END();

TimeFrameRestore();
2 comments
Leave Comment
Please login here to leave a comment.
Back
hi thank you for sharing this AFL. May I know what is the different of the numeric and color indication?
do you test