Stock Portfolio Organizer
The ultimate porfolio management solution.
Shares, Margin, CFD's, Futures and Forex
EOD and Realtime
Dividends and Trust Distributions
And Much More ....
WiseTrader Toolbox
#1 Selling Amibroker Plugin featuring:
Advanced Adaptive Indicators
Advanced Pattern Exploration
Neural Networks
And Much More ....
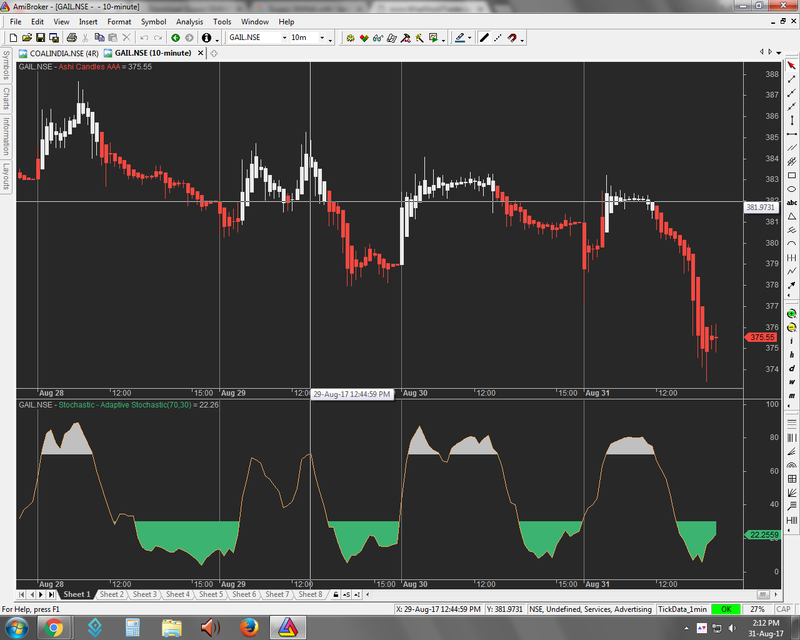
Adaptive Stochastic for Amibroker (AFL)
Rating:
4 / 5 (Votes 4)
Tags:
oscillator, amibroker, adaptive
Stochastics adapted to ensure better reading during overbought and oversold conditions instead of the usual, which tends to get crammed at the extremes.
Screenshots
Indicator / Formula
Copy & Paste Friendly
_SECTION_BEGIN("Period");

    SetBarsRequired( 1000, 1000);
    prc = ( High + Low ) / 2;
    Cyclepart = 0.7 ;
    pi=4*atan(1);
    RTD=180/pi;
    DTR=pi/180;

    Smooth[0] = Detrender[0] = I1[0] = Q1[0] = jI[0] = jQ[0] = I2[0] = I3[0] = Q3[0] = Q2[0] = Re[0] = Re1[0] =Im[0] = Im1[0] = 0;
    Period[0] = Period1[0] = alpha = cycle = SmoothPeriod[0] = imagpart[0] = realpart[0] = DCPhase[0] = 0;
    for ( i = 6; i < BarCount; i++ )
    {
    Smooth[i] = ( 4 * prc[i] + 3 * prc[i-1] + 2 * prc[i-2] + prc[i-3] ) / 10;
    Cycle[i] = ((1-0.5*alpha[i])^2)*(Smooth[i] - 2*Smooth[i-1] + Smooth[i-2]) + 2*(1-alpha[i])*Cycle[i-1] - ((1-alpha[i])^2)*Cycle[i-2];
    AmpCorr[i] = 0.075 * Period[i-1] + 0.54;
    Detrender[i] = ( 0.0962 * Smooth[i] + 0.5769 * Smooth[i-2] - 0.5769 * Smooth[i-4] - 0.0962 * Smooth[i-6] ) * AmpCorr[i];
    Q1[i] = ( 0.0962 * Detrender[i] + 0.5769 * Detrender[i-2] - 0.5769 * Detrender[i-4] - 0.0962 * Detrender[i-6] ) * AmpCorr[i];
    I1[i] = Detrender[i-3];
    jI[i] = ( 0.0962 * I1[i] + 0.5769 * I1[i-2] - 0.5769 * I1[i-4] - 0.0962 * I1[i-6] ) * AmpCorr[i];
    jQ[i] = ( 0.0962 * Q1[i] + 0.5769 * Q1[i-2] - 0.5769 * Q1[i-4] - 0.0962 * Q1[i-6] ) * AmpCorr[i];
    I2[i] = I1[i] - jQ[i];
    Q2[i] = Q1[i] + jI[i];
    I3[i] = 0.2 * I2[i] + 0.8 * I3[i-1];
    Q3[i] = 0.2 * Q2[i] + 0.8 * Q3[i-1];
    Re[i] = I3[i] * I3[i-1] + Q3[i] * Q3[i-1];
    Im[i] = I3[i] * Q3[i-1] - Q3[i] * I3[i-1];
    Re1[i] = 0.2 * Re[i] + 0.8 * Re1[i-1];
    Im1[i] = 0.2 * Im[i] + 0.8 * Im1[i-1];
    {
    if ( Im1[i] != 0 AND Re1[i] != 0 )    Period1[i] = 360*DTR / atan( Im1[i] / Re1[i] );
    else
    Period1[i] = Period1[i-1];
    }
    {
    if ( Period1[i] > 1.5 * Period1[i-1] )  Period2[i] = 1.5 * Period1[i-1];
    else
    {
    if ( Period1[i] < 0.67 * Period1[i-1] ) Period2[i] = 0.67 * Period1[i-1];
    else
    Period2[i] = Period1[i];
    }
    }
    {
    if ( Period2[i] < 6 )    Period3[i] = 6;
    else
    {
    if ( Period2[i] > 50 )   Period3[i] = 50;
    else
    period3[i]=Period2[i];
    }
    }
    Period[i] = 0.2 * Period3[i] + 0.8 * Period[i-1];
    SmoothPeriod[i] = 0.33 * Period[i] + 0.67 * SmoothPeriod[i-1];
    DCPeriod[i] = int(SmoothPeriod[i]+0.5);
}

_SECTION_END();
_SECTION_BEGIN("Stochastic - Adaptive Stochastic");
SetChartOptions(0,chartShowArrows|chartShowDates);
hh = HHV(H, DCPeriod) ;
ll = LLV(L, DCPeriod) ;
stoch = IIf ((hh-ll) > 0 ,((Close - ll)/(hh - ll)) * 100,0); ;
stochma =EMA(Stoch,3);
stochmb =EMA(Stochma,3);
UL=Param("UPPER LIMIT",70,60,90,1);
Ll=Param("LOWER LIMIT",30,10,40,1);
R=stochma;
Plot(stochma,"", ParamColor("Plot Color",colorLightOrange),ParamStyle("Plot Style",styleNoLabel));
GraphXSpace=10;
PlotOHLC( R,R,50,r, _DEFAULT_NAME(), IIf( R > 50, colorLightGrey , colorSeaGreen ), styleCloud | styleClipMinMax, LL, UL );
_SECTION_END();
0 comments
Leave Comment
Please login here to leave a comment.
Back