Stock Portfolio Organizer
The ultimate porfolio management solution.
Shares, Margin, CFD's, Futures and Forex
EOD and Realtime
Dividends and Trust Distributions
And Much More ....
WiseTrader Toolbox
#1 Selling Amibroker Plugin featuring:
Advanced Adaptive Indicators
Advanced Pattern Exploration
Neural Networks
And Much More ....
RSI Positive Divergence for Amibroker (AFL)
Rating:
4 / 5 (Votes 3)
Tags:
oscillator, amibroker, scan
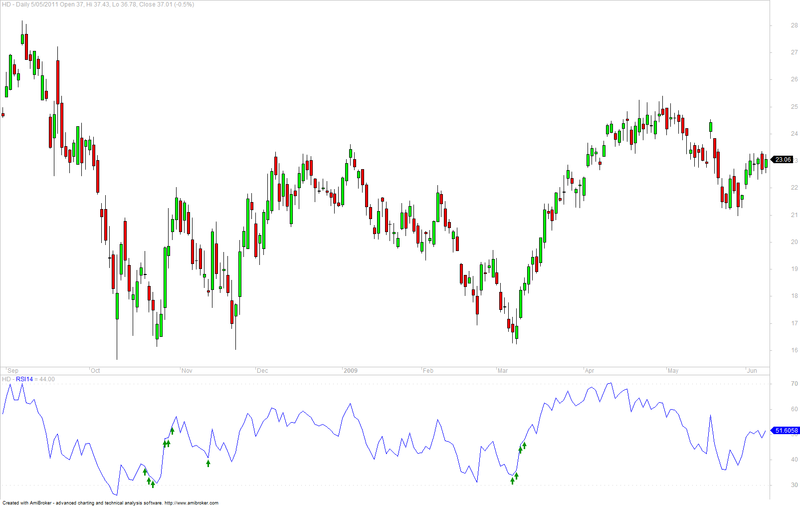
RSI positive divergence finder.
Screenshots
Indicator / Formula
Copy & Paste Friendly
x0 = LLV(RSI(14),30);
x1 = Ref(x0,-3) <33;
x2 = MA(RSI(14),5)<40;
x3 = MA(RSI(14),5)>35;
x4 = MA(C,5);
x5 = ValueWhen(Cross(40,RSI(14)),C,1);
x6 = ((x4-x5)/x5*100)<0 ;
a0 = x1 AND x2 AND x3 AND x6;

y1 = Ref(x0,-3)<33;
y2 = MA(RSI(14),5)<45;
y3 =  MA(RSI(14),5)>35;
y4 = MA(C,5);
y5 = ValueWhen(Cross(40,RSI(14)),C,1);
y6 = ((y4-y5)/y5*100) <-5;
a1 = y1 AND y2 AND y3 AND y6;

b1 = a0 + a1 >0;
Plot(RSI(14),"RSI14",colorBlue,styleLine);
PlotGrid(30,colorLightGrey,7,1);
PlotGrid(70,colorLightGrey,7,1);
Buy = b1;
PlotShapes(Buy*shapeUpArrow,colorGreen);
6 comments
Leave Comment
Please login here to leave a comment.
Back
error in ln 20 and ln 21,
pls solve
Works fine on my installed v6.26 beta. No errors.
if you are using an older version of the amibroker try this:
very nice
super coding dear friend
also I need negative divergence how to do tried some but failed
please give some idea or coding for negative DIV
@
x0=llv(rsi(14),30);
x1=ref(x0,-3) <33;
x2=ma(rsi(14),5)<45;
x3=ma(rsi(14),5)>35;
x4=ma(c,5);
x5=ValueWhen(Cross(40,rsi(14)),C,1);
x6=((x4-x5)/x5*100)<0 ;
b0=x1 AND x2 AND x3 AND x6;
t0=hhv(rsi(14),30);
t1=Ref(t0,-3)>75;
t2=ma(rsi(14),5)>60;
t3=ma(rsi(14),5)<70;
t4=ma(C,5);
t5=ValueWhen(Cross(rsi(14),75),C,1);
t6=((t5-t4)/t4*100)>0 ;
s0=t1 AND t2 AND t3 AND t6;
Plot(rsi(14),“RSI14”,colorBlue,styleLine);
PlotGrid(30,colorLightGrey,7,1);
PlotGrid(70,colorLightGrey,7,1);
Buy=b0;
Sell=s0;
PlotShapes(Buy*shapeUpArrow+Sell*shapeDownArrow,IIf(Buy,colorGreen,colorRed));
@