Overbought/Oversold Indicator for Amibroker (AFL)
r.siva79 about 16 years ago Amibroker (AFL)
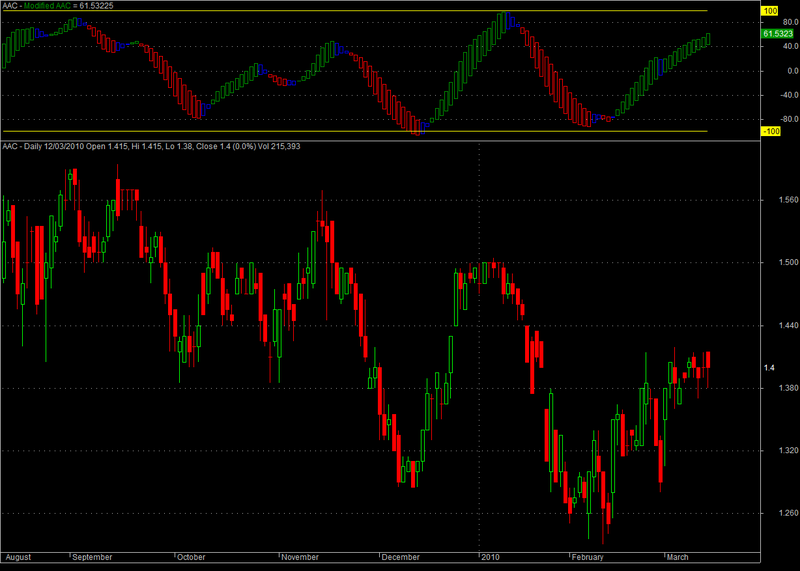
This indicator identifies over bought and over sold conditions.
Screenshots
Indicator / Formula
Copy & Paste Friendly
Plot(100,"",7,styleLine);
Plot(-100,"",7,styleLine);
n=9;
ys1=(High+Low+Close*2)/4;
rk3=EMA(ys1,n);
rk4=StDev(ys1,n);
rk5=(ys1-rk3)*100/rk4;
rk6=EMA(rk5,n);
UP=EMA(rk6,n);
DOWN=EMA(up,n);
Oo=IIf(up<down,up,down);
Hh=Oo;
Ll=IIf(up<down,down,up);
Cc=Ll;
barcolor2=IIf(Ref(oo,-1)<Oo AND Cc<Ref(Cc,-1),colorBlue,IIf(up>down,colorGreen,colorRed));
PlotOHLC( Oo,hh,ll,Cc, "Modified " + Name(), barcolor2, styleCandle );
3 comments
Leave Comment
Please login here to leave a comment.
good one!
DEAR SIR,
R.SIVA
over bought and over sold very nice but,make new one which is help with in figures too,……..
like spider.net or reliable
there is window for bulk traders which shows you figure in laks….
keep it up.. sir
if you have it….so, please send me
atinshah@gmail.com
*GOOD *