Stock Portfolio Organizer

The ultimate porfolio management solution.

Shares, Margin, CFD's, Futures and Forex
EOD and Realtime
Dividends and Trust Distributions
And Much More ....
For Portfolio Manager Click Here

WiseTrader Toolbox

#1 Selling Amibroker Plugin featuring:

Advanced Adaptive Indicators
Advanced Pattern Exploration
Neural Networks
And Much More ....
Find Out More Here

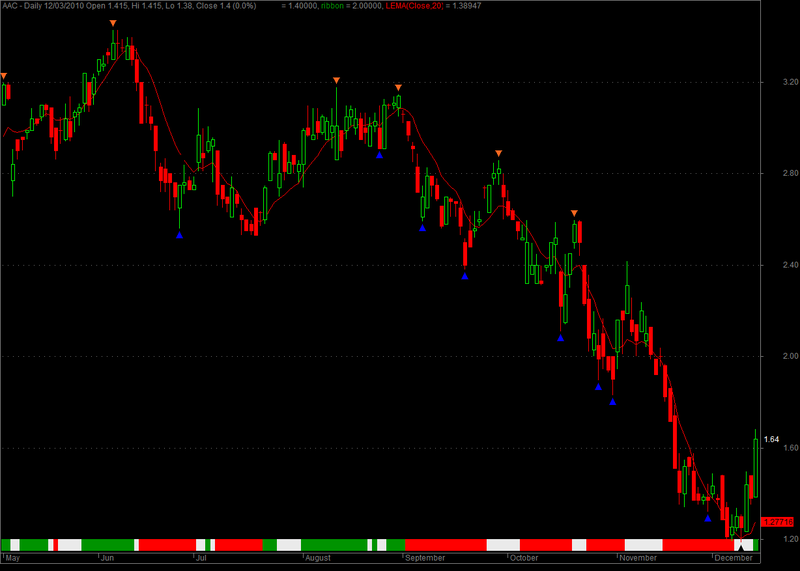
Elliot Fractals for Amibroker (AFL)

Rating:
2 / 5 (Votes 14)
Tags:
amibroker, elliot

The Indicator plot Elliot Fractals on The Price Chart

Screenshots

Similar Indicators / Formulas

Elliot 1 to 8
Submitted by kathamuthu about 13 years ago
Pivot Macd System with Elliot wave
Submitted by mohad almost 13 years ago
Pentuple Exponential Moving Average
Submitted by extremist about 11 years ago
Williams Alligator System
Submitted by durgesh1712 over 12 years ago
*Level Breakout system*
Submitted by Tinych over 12 years ago
You cannot view the code for the following reasons:
  • You must be a member and have contributed at least 1 indicator

17 comments

2. siddhisagar

hey why is that u have blocked most of the good ones then whats the point in visiting this site if u only have to go through the ones which are not the best
there are limited number of AFLS out there and u hardly find new ones does that men ppl who wnt to use thse cant , wht do u want that u are doing this

3. siddhisagar

i really want this formula can someone help me
and id rather not post some crappy formula and hamper someones trading and money

4. JosephMemphis

i agree!

5. rsdprasad

Very Good indicator

7. martik

ممنون م
بسيار عالي بود

8. voxmom

ممنون

9. NASSER

let me try it

10. WengWeng

Many Thank, I’ll try.

11. dollarheineken

Thanks you.

12. collinboy2001

thank you!

13. Ilham751

i cant copy code afl. please help me

Comment hidden - Show
16. azka shanum
//ELLIOT Fractals
_SECTION_BEGIN("Price");
SetChartOptions(0,chartShowArrows|chartShowDates);
_N(Title = StrFormat("{{NAME}} - {{INTERVAL}} {{DATE}} Open %g, Hi %g, Lo %g, Close %g (%.1f%%) {{VALUES}}", O, H, L, C, SelectedValue( ROC( C, 1 ) ) ));
Plot( C, "Close", ParamColor("Color", colorBlack ), styleCandle
| ParamStyle("Style") | GetPriceStyle() );
// Paste the code below to your price chart somewhere and green ribbon means both
// both MACD and ADX trending up so if the red ribbon shows up the MACD and the ADX
// are both trending down.

_SECTION_BEGIN("trending ribbon");
uptrend=PDI()>MDI()AND Signal()<MACD();
downtrend=MDI()>PDI()AND Signal()>MACD();


Plot( 2, /* defines the height of the ribbon in percent of pane width */"ribbon",
IIf( uptrend, colorGreen, IIf( downtrend, colorRed, 0 )), /* choose color */
styleOwnScale|styleArea|styleNoLabel, -0.5, 100 );

_SECTION_END();

_SECTION_END();

_SECTION_BEGIN("LEMA");
P = ParamField("Price field",-1);
Periods = Param("Periods", 20, 2, 200, 1, 10 );
lema = EMA (Close,Periods)+ EMA((Close-EMA(Close,Periods)),Periods);
Plot( lEMA, _DEFAULT_NAME(), ParamColor( "Color", colorCycle ),
ParamStyle("Style") );
_SECTION_END();

_SECTION_BEGIN("ELLIOTT Fractals");
/*
The basic definition of an 'up' fractal is a bar high that is both higher than the two bars immediately preceding it
and higher than the two bars immediately following it.
The lows of the bars are NOT considered in determining the up fractal progression.

If two bars in the progression have equal highs followed by two consecutive bars with lower highs,
then a total of six bars rather than the usual five bars will make up the progression.
The first High becomes the counting fractal. Reverse for 'down' fractals.

The 5 bar formation works best on Daily or longer time frame charts.For intraday data charts we often use 9 bar, 13 bar and 21 bar formations for fractal counting
*/
Up5BarFractal = Ref(H,-2) < H AND Ref(H,-1) < H AND Ref(H,1) < H AND Ref(H,2) < H;
Up6BarFractal = Ref(H,-2) < H AND Ref(H,-1) < H AND (H == Ref(H,1)) AND Ref(H,2) < H AND Ref(H,3) < H;
Down5BarFractal = Ref(L,-2) > L AND Ref(L,-1) > L AND Ref(L,1) > L AND Ref(L,2) > L;
Down6BarFractal = Ref(L,-2) > L AND Ref(L,-1) > L AND (L == Ref(L,1)) AND Ref(L,2) > L AND Ref(L,3) > L;

//TODO: More filtering: Show only troughs that are around atrough in trix(9).

PlotShapes( IIf(Down5BarFractal ,shapeSmallUpTriangle,0) ,colorBlack, 0, L,-12);
PlotShapes( IIf(Down6BarFractal ,shapeSmallUpTriangle,0) ,colorBlack, 0, L,-12);

PlotShapes( IIf(Up5BarFractal ,shapeSmallDownTriangle,0) ,colorBlack, 0, H,-12);
PlotShapes( IIf(Up6BarFractal ,shapeSmallDownTriangle,0) ,colorBlack, 0, H,-12);

Up = (Up5BarFractal OR Up6BarFractal);
Down = (Down5BarFractal OR Down6BarFractal);
//Removing false fractals:
DownSignal = Flip(Ref(Up,-1), Ref(Down,-1));
UpSignal = Flip(Ref(Down,-1), Ref(Up,-1));

LastHigh[0] = H[0];
LastLow[0] = L[0];

LastLowIndex = 0;
LastHighIndex = 0;
Valid = 0;
for (i=1; i < BarCount; i++)
{

LastHigh[i] = LastHigh[i-1];
LastLow[i] = LastLow[i-1];
if (Up[i])
{
Valid[i] = True;
if (DownSignal[i])
{
//Sequence of 2 Up Fractals. Validate only the higher one.
Valid[i] = H[i] >= H[LastHighIndex];
Valid[LastHighIndex] = H[LastHighIndex] > H[i];
}
LastHigh[i] = Max(H[i], H[LastHighIndex ]);
LastHighIndex = i;
}

if (Down[i])
{
Valid[i] = True;
if (UpSignal[i])
{
//Sequence of 2 Down Fractals. Validate only the lower one.
Valid[i] = L[i] <= L[LastLowIndex];
Valid[LastLowIndex] = L[LastLowIndex] < L[i];
}

LastLow[i] = Min(L[i], L[LastLowIndex]);
LastLowIndex = i;
}
}

TrixN = Trix(9);
TroughLow = Ref(TrixN, -3) > TrixN AND Ref(TrixN, -2) > TrixN AND Ref(TrixN, -1) > TrixN AND Ref(TrixN, 1) > TrixN AND Ref(TrixN, 2) > TrixN AND Ref(TrixN, 3) > TrixN;
TroughHigh = Ref(TrixN, -3) < TrixN AND Ref(TrixN, -2) < TrixN AND Ref(TrixN, -1) < TrixN AND Ref(TrixN, 1) < TrixN AND Ref(TrixN, 2) < TrixN AND Ref(TrixN, 3) < TrixN;
//TroughLow = Ref(TrixN, -2) > TrixN AND Ref(TrixN, -1) > TrixN AND Ref(TrixN, 1) > TrixN AND Ref(TrixN, 2) > TrixN;
//TroughHigh = Ref(TrixN, -2) < TrixN AND Ref(TrixN, -1) < TrixN AND Ref(TrixN, 1) < TrixN AND Ref(TrixN, 2) < TrixN;
ZeroValid = Cross(TrixN, 0) OR Cross(0, TrixN) OR Ref(Cross(TrixN, 0),1) OR Ref(Cross(0, TrixN),1);
ValidLow = TroughLow OR Ref(TroughLow, 1) OR Ref(TroughLow, 2) OR Ref(TroughLow, 3) OR Ref(TroughLow, 4);// OR Ref(TroughLow, 5));
ValidHigh = TroughHigh OR Ref(TroughHigh, 1) OR Ref(TroughHigh, 2) OR Ref(TroughHigh, 3) OR Ref(TroughHigh, 4);// OR Ref(TroughHigh, 5));

//Plot(LastHigh-10 ,"LastHigh", colorBlue, styleLine);
//Plot(LastLow-10 ,"LastLow ", colorRed, styleLine);
//Plot(Valid*5 + 10 ,"LastLow ", colorGreen, styleLine | styleThick);

//PlotShapes( IIf(Down AND Valid,shapeSmallCircle,0) ,colorGreen, 0, L,-12);
//PlotShapes( IIf(Up AND Valid,shapeSmallCircle,0) ,colorYellow, 0, H,-12);
Maxi = Up AND (ValidHigh OR ZeroValid);
Mini = Down AND (ValidLow OR ZeroValid);
PlotShapes( IIf(Down AND (ValidLow OR ZeroValid),shapeSmallUpTriangle,0) ,colorBlue, 0, L,-12);
PlotShapes( IIf(Up AND (ValidHigh OR ZeroValid),shapeSmallDownTriangle,0) ,colorOrange, 0, H,-12);
Buy=Cover=IIf(Down AND (ValidLow OR ZeroValid),1,0);
Sell=Short=IIf(Up AND (ValidHigh OR ZeroValid),1,0);
//Plot(UpSignal*3+5,"UpSignal", colorBlue, styleLine| styleThick);
//Plot(DownSignal*3 ,"DownSignal", colorRed, styleLine| styleThick);

/*
LastMaxi = 0;
LastMini = 0;
ElliotLines = 0;
State = 0;
for (i=1; i < BarCount; i++)
{
State[i] = State[i-1];
if (Maxi[i])
{
State[i] = 1;//down
}

if (Mini[i])
{
State[i] = 2;
}

}

PlotShapes(IIf(State > 0, shapeSmallCircle, 0), IIf(State == 1, colorRed, colorBlue), 0, IIf(State == 1, H, L), -5);
*/
//Line = LineArray( x0, y0, x1, y1, 1 );
//Plot( Line, "Trend line", colorBlue );

/*
Wave B
Usually 50% of Wave A
Should not exceed 75% of Wave A
Wave C
either 1 x Wave A
or 1.62 x Wave A
or 2.62 x Wave A
*/
function CorrectiveRatios(StartPrice, A, B, C, RatioDelta, Delta)
{

ALength = abs(startPrice - A); BLength = abs(A-B);
CLength = abs(B-C);

Ratio1 = BLength / CLength ;
Cond1 = Ration1 >= 0.5 - RatioDelta AND ratio1 <= 0.75 + RatioDelta;
Cond2 = abs(Clength - ALength) < Delta OR abs(Clength - 1.62 * ALength) < Delta OR abs(CLength - 2.62 * ALength) < Delta;

return Cond1 AND Cond2;
}

function ImpulseRules(StartPrice, One, Two, Three, Four, Five)
{
//Wave 2 should be beneath wave 1 start:
Cond1 = Two > StartPrice AND Two < One;
//Wave 4 - the same:
Cond2 = Four > Two AND Four < Three;
//Wave 5 should be <= wave 3
Cond3 = abs(Three-Two) >= abs(Five - Four);
//Wave 1 should be smaller than wave five, making wave 3 the biggest:
Cond4 = abs(StartPrice - One) < abs(Five - Four);
return Cond1 AND Cond2 AND Cond3 AND Cond4;
}
_SECTION_END();
17. alialia

very good

18. vahid232

عالی

19. w1881w

i agree

Comment hidden - Show

Leave Comment

Please login here to leave a comment.

Back