Stock Portfolio Organizer
The ultimate porfolio management solution.
Shares, Margin, CFD's, Futures and Forex
EOD and Realtime
Dividends and Trust Distributions
And Much More ....
WiseTrader Toolbox
#1 Selling Amibroker Plugin featuring:
Advanced Adaptive Indicators
Advanced Pattern Exploration
Neural Networks
And Much More ....
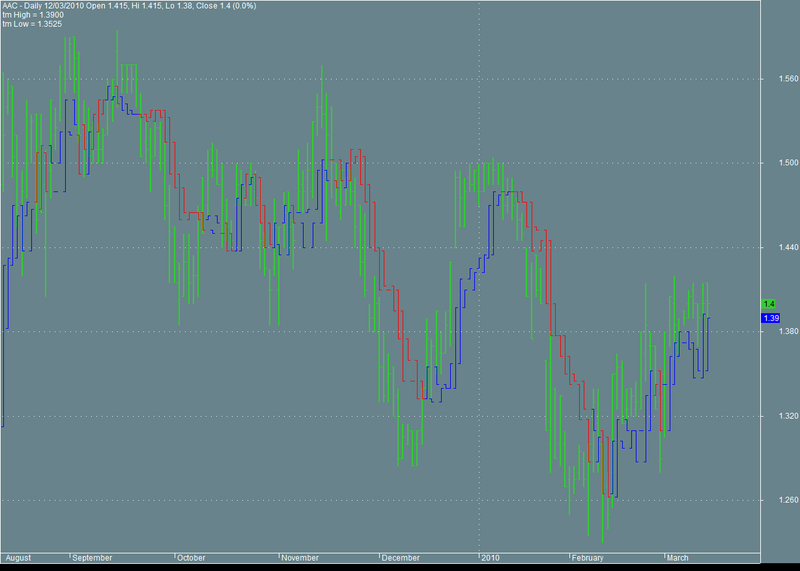
Stop Loss Indicator for Amibroker (AFL)
Rating:
5 / 5 (Votes 1)
Tags:
amibroker, stop loss
This indicator plots a stop loss on a chart. It works for both long and short.
Screenshots
Similar Indicators / Formulas
DODA BAND BUY SELL
Submitted
by saas almost 11 years ago
JMA Stoploss
Submitted
by kuzukapama almost 13 years ago
TSL & HL & New
Submitted
by morgen almost 12 years ago
ABKP Benchmark Bar
Submitted
by amitabh about 14 years ago
Profit Trailing Stoploss
Submitted
by drpragnesh40 almost 11 years ago
Indicator / Formula
Copy & Paste Friendly
_SECTION_BEGIN("TM");
//AFL works on amibroker version 5.20 and above
SetChartBkColor(colorPaleBlue);
p=Param("period",7,3,20,1);
pl1=ParamToggle("Plot Stoploss line","No,Yes",0);
pl2=ParamToggle("Plot Setup signals","No,Yes",0);

Hx=IIf(H<Ref(H,-p),Ref(H,-p),H);
Lx=IIf(L>Ref(L,-p),Ref(L,-p),L);
Hxl=IIf(H<Ref(H,-p),Ref(H,-p),H);
Lxl=IIf(L>Ref(L,-p),Ref(L,-p),L);
spana=(Hx+Lx)/2;
spanb=Ref(spana,-2);
for( i = p; i < BarCount; i++ )
{
if (spana[i]>spanb[i])
{
H1[i]=spana[i];
L1[i]=spanb[i];
O1[i]=L1[i];
C1[i]=H1[i];
}
else
{
H1[i]=spanb[i];
L1[i]=spana[i];
O1[i]=H1[i];
C1[i]=L1[i];
}
}
PlotOHLC(O1,H1,L1,C1,"",IIf(C>spanb,colorBlue,colorRed),ParamStyle("Plot Style",styleBar,maskPrice));
Plot(C,"",ParamColor("Bar Color",colorLime),128+4);
pd=(C>spanb AND Ref(C,-1)>Ref(spanb,-1));
nd=(C<spana AND Ref(C,-1)<Ref(spana,-1));
Buysetup= PD;
Shortsetup=nd;
Buysetupvalid=Flip (Buysetup, Shortsetup);
Shortsetupvalid=Flip (Shortsetup, Buysetup);Buy=Cover= Ref (Buysetupvalid, - 1) ==1 AND H>ValueWhen (buysetup, H) +0.01;Short=Sell=Ref (Shortsetupvalid, - 1) ==1 AND L<ValueWhen (Shortsetup, L) - 0.01;Buy=ExRem (Buy, Sell);Sell=ExRem (Sell, Buy);Short=ExRem (Short, Cover);Cover=ExRem (Cover, Short);
inlong=Flip(Buy,Sell);
inshort=Flip(Sell,Buy);
Plot(IIf(Buysetup AND pl1,spanb,Null),"",colorRed,styleDashed);
Plot(IIf(shortsetup AND pl1,spanb,Null),"",colorRed,styleDashed);
shortsetupvalid=ExRem (shortsetupvalid, buysetupvalid);
buysetupvalid=ExRem (buysetupvalid, shortsetupvalid);
PlotShapes (IIf (shortsetupvalid AND pl2,shapeDownTriangle, shapeNone), colorRed, 0, H, - 40);
PlotShapes (IIf (buysetupvalid AND pl2,shapeUpTriangle, shapeNone), colorGreen, 0, L, - 40);

SetChartOptions(0,chartShowArrows|chartShowDates);Title = StrFormat("{{NAME}} - {{INTERVAL}} {{DATE}} Open %g, Hi %g, Lo %g, Close %g (%.1f%%) {{VALUES}}", O, H, L, C, SelectedValue( ROC( C, 1 ) ) )+
"\n"+"tm High = "+WriteVal(spana,1.4)
+ "\n"+"tm Low = "+WriteVal(spanb,1.4);
_SECTION_END();
0 comments
Leave Comment
Please login here to leave a comment.
Back