Stock Portfolio Organizer
The ultimate porfolio management solution.
Shares, Margin, CFD's, Futures and Forex
EOD and Realtime
Dividends and Trust Distributions
And Much More ....
WiseTrader Toolbox
#1 Selling Amibroker Plugin featuring:
Advanced Adaptive Indicators
Advanced Pattern Exploration
Neural Networks
And Much More ....
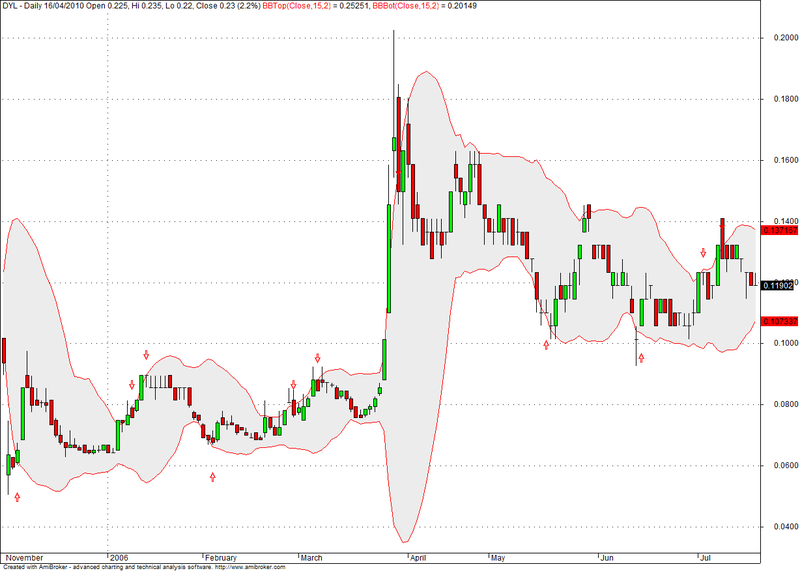
BB Trading for Amibroker (AFL)
Rating:
3 / 5 (Votes 3)
Tags:
amibroker, bands
Bollinger bands are a technical analysis tool invented by John Bollinger in the 1980s. Having evolved from the concept of trading bands, Bollinger bands can be used to measure the highness or lowness of the price relative to previous trades.
Bollinger bands consist of:
- a middle band being an N-period simple moving average (MA)
- an upper band at K times an N-period standard deviation above the middle band (MA + Kσ)
- a lower band at K times an N-period standard deviation below the middle band (MA − Kσ)
Typical values for N and K are 20 and 2, respectively. The default choice for the average is a simple moving average, but other types of averages can be employed as needed. Exponential moving averages are a common second choice. Usually the same period is used for both the middle band and the calculation of standard deviation.
Screenshots
Similar Indicators / Formulas
%B of Bollinger Bands With Adaptive Zones
Submitted
by kaiji over 14 years ago
Trend Bands
Submitted
by rogercraft about 14 years ago
Bollinger - Keltner Bands
Submitted
by kaiji over 14 years ago
Bollinger %B
Submitted
by konidena about 14 years ago
Bollinger Band Squeeze & Expansion
Submitted
by razasia about 14 years ago
Jurik's Spandex Band
Submitted
by xavier over 12 years ago
Indicator / Formula
Copy & Paste Friendly
//BB trading by Dimaz
//rev 0.1 outlines


_SECTION_BEGIN("Price");
SetChartOptions(0,chartShowArrows|chartShowDates);
_N(Title = StrFormat("{{NAME}} - {{INTERVAL}} {{DATE}} Open %g, Hi %g, Lo %g, Close %g (%.1f%%) {{VALUES}}", O, H, L, C, SelectedValue( ROC( C, 1 ) ) ));
Plot( C, "Close", ParamColor("Color", colorBlack ), styleNoTitle | ParamStyle("Style") | GetPriceStyle() );
_SECTION_END();

_SECTION_BEGIN("Bollinger Bands");
P = ParamField("Price field",-1);
Periods = Param("Periods", 15, 2, 100, 1 );
Width = Param("Width", 2, 0, 10, 0.05 );
Color = ParamColor("Color", colorCycle );
Style = ParamStyle("Style");
Plot( BBandTop( P, Periods, Width ), "BBTop" + _PARAM_VALUES(), Color, Style );
Plot( BBandBot( P, Periods, Width ), "BBBot" + _PARAM_VALUES(), Color, Style );
DisplayBBColor=ParamToggle("Display BB Color","No,Yes",1);
ColorBB=ParamColor("BB color",ColorRGB(236,236,236));
if (DisplayBBColor==1) PlotOHLC(Null,BBandTop( P, Periods, Width ),BBandBot( P, Periods, Width ),Null,"",ColorBB,styleCloud+styleNoLabel);
_SECTION_END();

_SECTION_BEGIN("BB Trading by Dimaz");
Sell=Cross(BBandTop( P, Periods, Width ),P);
Buy=Cross(P,BBandBot( P, Periods, Width ));
displayArrow=ParamToggle("Display Arrow","No|Yes",1);
if (displayArrow==1) PlotShapes(IIf(Sell, shapeHollowDownArrow , shapeNone), colorRed, 0, Low, Offset=-50);
if (displayArrow==1) PlotShapes(IIf(Buy, shapeHollowUpArrow , shapeNone), colorRed, 0, Low, Offset=-50);
_SECTION_END();
3 comments
Leave Comment
Please login here to leave a comment.
Back
A similar afl “Color Bollinger Band for Amibroker”, is available in Pastie though this one gives better signals.
Thanks for heads up but pasties are not counted towards anything and are anonymous. Its for people to have a facility to share formulas with each other and on forums.
Its very useful indicator when combined with RSI, thanks for sharing.