Stock Portfolio Organizer
The ultimate porfolio management solution.
Shares, Margin, CFD's, Futures and Forex
EOD and Realtime
Dividends and Trust Distributions
And Much More ....
WiseTrader Toolbox
#1 Selling Amibroker Plugin featuring:
Advanced Adaptive Indicators
Advanced Pattern Exploration
Neural Networks
And Much More ....
Camarilla Pivots for Amibroker (AFL)
Rating:
3 / 5 (Votes 2)
Tags:
amibroker, pivots
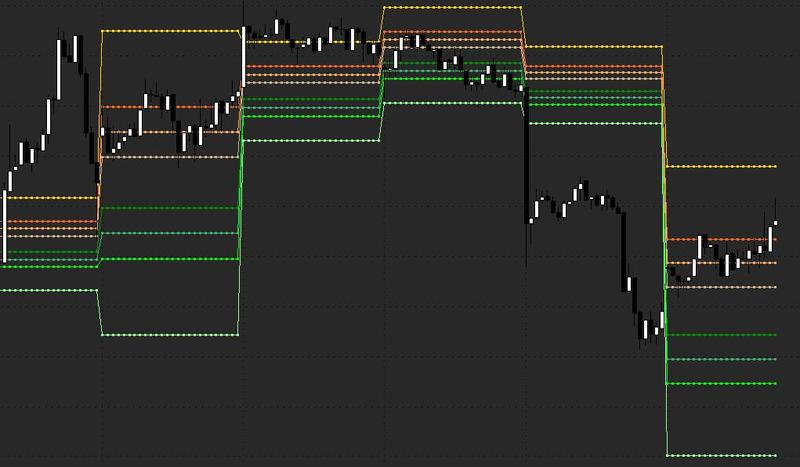
Calculates Camarilla Pivots and Plots it.
Screenshots
Similar Indicators / Formulas
Pivots and prices
Submitted
by kaiji over 14 years ago
Pivots And Prices And Swing Volume
Submitted
by esnataraj almost 14 years ago
Pivot Trading All-In-One
Submitted
by kirthi1987 about 14 years ago
Daily, Weekly and Monthly Pivots
Submitted
by sam_u6 about 14 years ago
Tomorrow's pivots
Submitted
by morgen almost 13 years ago
Indicator / Formula
Copy & Paste Friendly
_SECTION_BEGIN("Price");
SetChartOptions(0,chartShowArrows|chartShowDates);
_N(Title = StrFormat("{{NAME}} - {{INTERVAL}} {{DATE}} Open %g, Hi %g, Lo %g, Close %g (%.1f%%) {{VALUES}}", O, H, L, C, SelectedValue( ROC( C, 1 ) ) ));
Plot( C, "Close", ParamColor("Color", colorBlack ), styleNoTitle | ParamStyle("Style") | GetPriceStyle() );
_SECTION_END();

//---- pivot points
DayH = TimeFrameGetPrice("H", inDaily, -1); // yesterdays high
DayL = TimeFrameGetPrice("L", inDaily, -1); // low
DayC = TimeFrameGetPrice("C", inDaily, -1); // close
DayO = TimeFrameGetPrice("O", inDaily); // current day open


//............camarilla pivots

H4 = ( (DayH-DayL) * (1.1/2) ) + DayC;
H3 = ( (DayH-DayL) * (1.1/4) ) + DayC;
H2 = ( (DayH-DayL) * (1.1/6) ) + DayC;
H1 = ( (DayH-DayL) * (1.1/12) ) + DayC;

L1 = DayC - ( (DayH-DayL) * (1.1/12) );
L2 = DayC - ( (DayH-DayL) * (1.1/6) ) ;
L3 = DayC - ( (DayH-DayL) * (1.1/4) ) ;
L4 = DayC - ( (DayH-DayL) * (1.1/2) ) ;

Plot(H4, "H4",colorGold,styleDots);
Plot(H3, "H3",colorOrange,styleDots);
Plot(H2, "H2",colorLightOrange,styleDots);
Plot(H1, "H1",colorTan,styleDots);

Plot(L4, "L4",colorPaleGreen,styleDots);
Plot(L3, "L3",colorBrightGreen,styleDots);
Plot(L2, "L2",colorSeaGreen,styleDots);
Plot(L1, "L1",colorGreen,styleDots);
2 comments
Leave Comment
Please login here to leave a comment.
Back
before putting it on site just see that how is the visibility of candles/charts. first we must see the charts then comes pivots etc. not easy for everybody to change it better change it with good quality visibility of candles that is the request.
Is there a way to show only the current day pivots?