Stock Portfolio Organizer
The ultimate porfolio management solution.
WiseTrader Toolbox
#1 Selling Amibroker Plugin featuring:
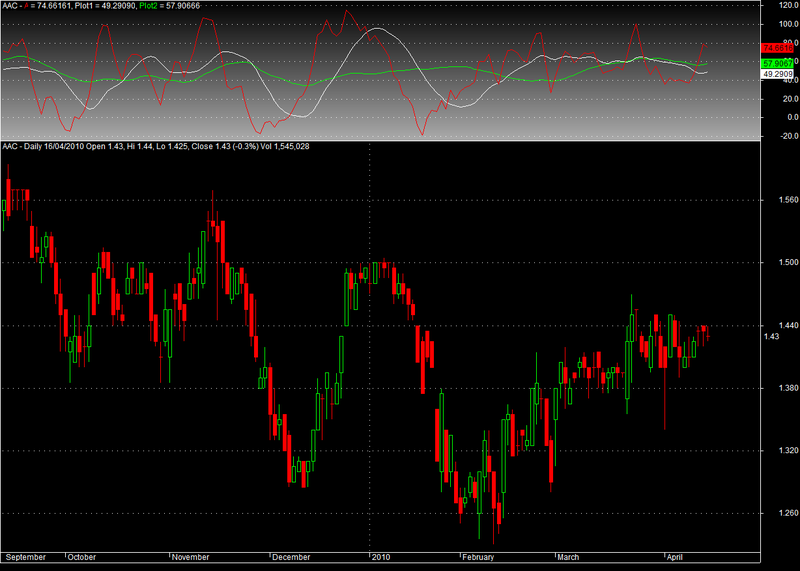
RSI COMPOSTIE for Amibroker (AFL)
From the book Breakthroughs in Technical Analysis
The Composite Index was developed to solve the divergence failure problem in the
RSI, but its ability to provide specific horizontal levels of support within the indicator adds to
its value. The Composite Index takes the normalized formula of RSI and removes the
normalization range restrictions. In Figure 5.7, the divergence to RSI in the Composite Index
is seen at points N and P. The formula for the Composite Index uses an embedded
momentum calculation with a short-term RSI smoothed. The concept of embedding a
momentum study can be used within MACD (moving average convergence/divergence), but
stochastics should not use this concept in fast formulas. If slow %D is used, this concept
can be applied, but extensive testing is recommended, as this is not how I used the formula
to gain confidence under fire in all financial markets in a real-time environment.
Screenshots
Similar Indicators / Formulas
Indicator / Formula
_SECTION_BEGIN("RSI COMPOSITE");
A=  RSI(14)-Ref(RSI(14),-9) + MA(RSI(3),3);
PLOT1= MA(A,13);
Plot2= MA(A,33);


Plot(A,"A",colorRed,styleLine);
Plot(Plot1,"Plot1",colorWhite,styleLine);
Plot(Plot2,"Plot2",colorBrightGreen,styleLine);
_SECTION_END();

_SECTION_BEGIN("color1");
SetChartBkGradientFill( ParamColor("BgTop", ColorRGB( 172,172,172 )),

ParamColor("BgBottom", ColorRGB( 172,172,172 )),ParamColor("titleblock",ColorRGB( 172,172,172 )));
_SECTION_END();
0 comments
Leave Comment
Please login here to leave a comment.
Back