Stock Portfolio Organizer
The ultimate porfolio management solution.
Shares, Margin, CFD's, Futures and Forex
EOD and Realtime
Dividends and Trust Distributions
And Much More ....
WiseTrader Toolbox
#1 Selling Amibroker Plugin featuring:
Advanced Adaptive Indicators
Advanced Pattern Exploration
Neural Networks
And Much More ....
EMA Crossover Trading for Amibroker (AFL)
Rating:
5 / 5 (Votes 2)
Tags:
trading system, amibroker, moving average
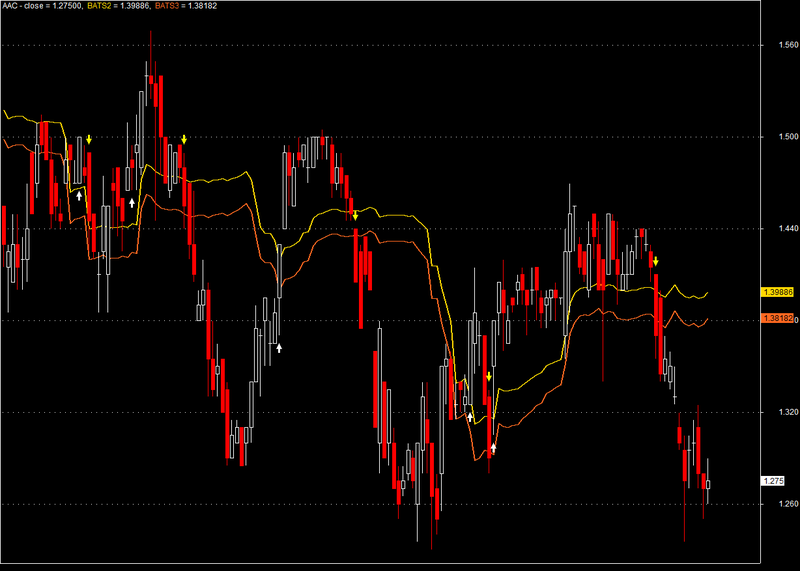
This is a simple Candle Stick Chart which plots buy & sell signals considering EMA crossover of price. It also has got an stop line plotted.
Screenshots
Similar Indicators / Formulas
Positional trading
Submitted
by technotrader almost 10 years ago
Moving Average Pullbacks System
Submitted
by kaiji over 14 years ago
Guppy MMA Convergence Divergence Histogram
Submitted
by walid over 13 years ago
Moving Average Difference
Submitted
by rananjay00007 about 14 years ago
Debdulal And Soumya
Submitted
by siivaramm over 13 years ago
Super TEMA
Submitted
by HARI123 over 13 years ago
Indicator / Formula
Copy & Paste Friendly
_SECTION_BEGIN("Kandle");


Plot(C,"close",IIf(O>C,colorRed,colorWhite),styleCandle);


_SECTION_END();


_SECTION_BEGIN("Stops");
//Concept from Bulkowski’s Stop Placement.For further details go to http://thepatternsite.com/stops.html.
//First coded by Southwind from chartistsbd.net
//Modified by Rais.


pr=Param("Period",22,2,100,1);

Sumdif=0;
dif=0;
for(i=0;i<pr;i++)
{
dif=Ref(High,-i)-Ref(Low,-i);
Sumdif=Sumdif+dif;
}

Sumdif=Sumdif/pr;

mp = Param("Multiplier",2,0.25,5,0.25);
Sumdifml=(Sumdif*1);
Sumdifml2=(Sumdif*1.5);
Sumdifml3=(Sumdif*mp);

bt=Param("BETA Stop",22,2,100,1);

p=ParamField("Price Field",3);

Betastops=HHV(p,bt) - Sumdifml;
Betastops2=HHV(p,bt) - Sumdifml2;
Betastops3=HHV(p,bt) - Sumdifml3;


//Plot(Betastops, " BATS", ParamColor( "Color", colorYellow ),ParamStyle("Style",styleThick,maskAll));
Plot(Betastops2, " BATS2", ParamColor( "Color2", colorGold ),ParamStyle("Style2",styleThick,maskAll));
Plot(Betastops3, " BATS3", ParamColor( "Color3", colorOrange ),ParamStyle("Style3",styleThick,maskAll));


_SECTION_END();


_SECTION_BEGIN("expl-");


fastmalenght=9;
slowmalength=16;
fastma=EMA( C, fastmalenght );
slowma=EMA( C, slowmalength );

eBuy=Cross( fastma , slowma );

xbuy=ADX()>10;


eSell=Cross( slowma , fastma );
batsell=(Close<Betastops3 );


Buy=eBuy AND xbuy;
Sell = (esell) OR (batsell);


/* exrem is one method to remove surplus strade signals. It removes excessive signals of arrow */
Buy = ExRem(Buy, Sell);
Sell = ExRem(Sell, Buy);
ApplyStop(stopTypeLoss,stopModePercent,Optimize( "maX. loss stop level", 12, 2, 30, 1 ),True );
_SECTION_END();


_SECTION_BEGIN("Shape");

PlotShapes(IIf(Sell==1, shapeDownArrow, shapeNone), colorYellow, 0,High, Offset=-20);
PlotShapes(IIf(Buy==1, shapeUpArrow , shapeNone), colorWhite, 0,Low, Offset=-20);


_SECTION_END();
1 comments
Leave Comment
Please login here to leave a comment.
Back
Good