Stock Portfolio Organizer
The ultimate porfolio management solution.
Shares, Margin, CFD's, Futures and Forex
EOD and Realtime
Dividends and Trust Distributions
And Much More ....
WiseTrader Toolbox
#1 Selling Amibroker Plugin featuring:
Advanced Adaptive Indicators
Advanced Pattern Exploration
Neural Networks
And Much More ....
Super Trend for Amibroker (AFL)
Rating:
3 / 5 (Votes 11)
Tags:
amibroker, trend
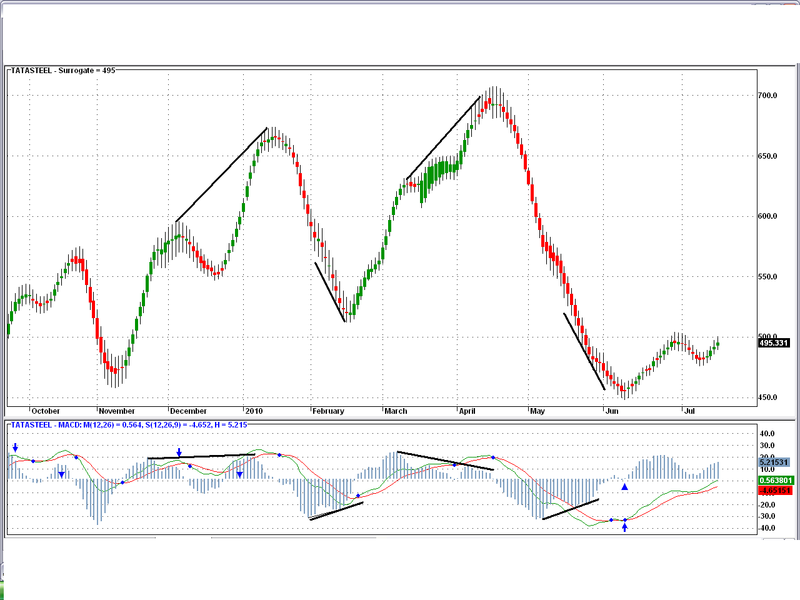
This is a trend following system which ignores minor swings in the trend ( Up / Down ) – Entry and Exit are based on emergence of consecutive red – green medium body candles with the highest high or lowest low of the previous 2 candle as the stop loss . This indicator can be supported with the standard MACD buy sell signals ( Crossovers) . I have attached @ chart of TataSteel .. Exact buy sell signals are obtained @ peaks and bottoms not falling into the divergence traps of MACD histogram .
Regards .
Arjun
Screenshots
Similar Indicators / Formulas
Trend Following Indicator
Submitted
by trek about 14 years ago
Seasionality
Submitted
by saiflingkon almost 13 years ago
PROFIT TRADING SYSTEM
Submitted
by Muralikrishna over 10 years ago
An n bar Reversal Indicator
Submitted
by kaiji about 14 years ago
Vertical Horizontal Filter
Submitted
by mahesh.aranake about 14 years ago
TrendChart v2.0 by rmike
Submitted
by rmike about 14 years ago
Indicator / Formula
Copy & Paste Friendly
_SECTION_BEGIN("Movint trand Surrogate");
mtOpen = LinearReg( Open, 20 ); // calculate moving trend from open
mtHigh = LinearReg( High, 20 ); // calculate moving trend from open
mtLow = LinearReg( Low, 20 ); // calculate moving trend from open
mtClose = LinearReg( Close, 20 ); // calculate moving trend from open
// plot surrogate chart
PlotOHLC( mtOpen, mtHigh, mtLow, mtClose, "Surrogate", colorBlack, styleCandle );


_SECTION_END();
12 comments
Leave Comment
Please login here to leave a comment.
Back
arjun the colour of candle is black it does not change when applied, pls help, and thanx for this.
Good one! I’ve been scratching my head as to how to make a graph that can remove minor trends, almost like a super heiken ashi! This is gold for me…thanks
Add this line below mtClose:
trendcolor = IIf(mtClose > mtOpen, colorGreen, colorRed);
Change
// plot surrogate chart
PlotOHLC( mtOpen, mtHigh, mtLow, mtClose, “Surrogate”, colorBlack, styleCandle );
to
// plot surrogate chart
PlotOHLC( mtOpen, mtHigh, mtLow, mtClose, “Surrogate”, trendcolor, styleCandle );
This is beauty in simplicity. Thanks dear Arjun. Dear sethmo, the change you suggested works well.
I do not have words to say thank you to this brilliant effort, hats off and credit goes to Arjun.
Very nice indicator, thank you!
I have also been searching for MACD with divergence, like on the sample picture. I like the ploted
lines on the chart, so i can see where the divergence is comming from.
Anyone know the formula for the MACD with ploted divergence?
its a nice piece of code , can any one plz advice equivalent for PlotOHLC in metastock ?
Dear Arjun please help me .
color of candle is black it does not change when applied, pls help, and thanx for this.
Thanks, Sethmo
Thanks a lot.
super sir excellent work
god bless you
very nice bro