Stock Portfolio Organizer
The ultimate porfolio management solution.
Shares, Margin, CFD's, Futures and Forex
EOD and Realtime
Dividends and Trust Distributions
And Much More ....
WiseTrader Toolbox
#1 Selling Amibroker Plugin featuring:
Advanced Adaptive Indicators
Advanced Pattern Exploration
Neural Networks
And Much More ....
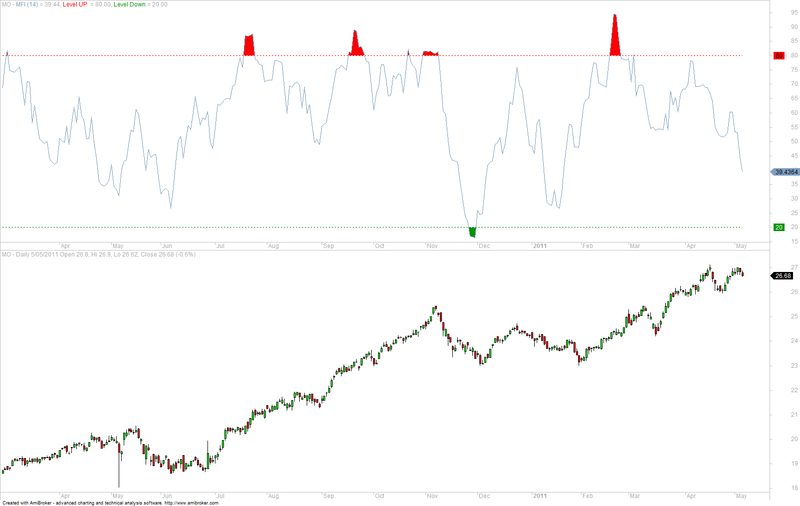
Money Flow Index (MFI) with Color & Clip Area for Amibroker (AFL)
Rating:
3 / 5 (Votes 3)
Tags:
MFI
The money flow index (MFI) is an oscillator that ranges from 0 to 100. It is used to show the money flow (an approximation of the dollar value of a day’s trading) over several days.
Screenshots
Indicator / Formula
Copy & Paste Friendly
// MFI with Color and Clip Area
// NHT
// Date: 10/Mar/2018

SetChartOptions(0,0,ChartGrid50,0,100);

periods = Param("Periods", 14, 1, 200, 1);
Levelup = Param("Level up",80,1,100,1);
Leveldown = Param("Level down",20,1,100,1);

z = MFI(periods);

LineColor = ParamColor("Line Color", colorLightBlue );
LineStyle = ParamStyle("Line Style", styleLine);
LevelupColor = ParamColor("Overbought Color",colorRed);
LeveldownColor = ParamColor("Oversold Color",colorGreen);

Plot(z, "MFI (" + periods + ")", LineColor , LineStyle);
Plot(Levelup,"Level UP ",LevelupColor,styleDashed);
Plot(Leveldown,"Level Down",LeveldownColor,styleDashed);
PlotOHLC(z,z,50,z,"",IIf(z>50, LevelupColor, LeveldownColor), styleCloud | styleNoLabel | styleClipMinMax, Leveldown, Levelup);
1 comments
Leave Comment
Please login here to leave a comment.
Back
Admin, please help review & approve. Many thanks!!!