Visual Indicator Dashboard for Amibroker (AFL)
kaiji almost 16 years ago Amibroker (AFL)
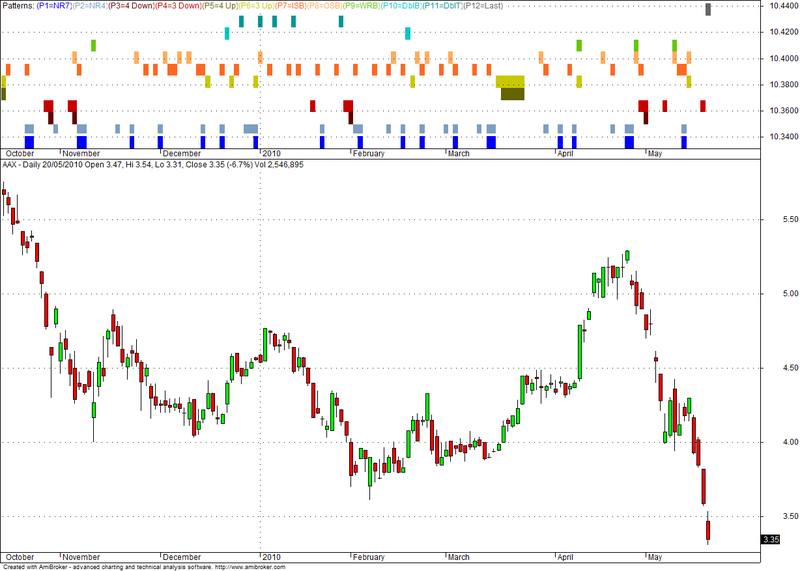
This dashboard is useful for showing the current state of any test you might like to check for in relation to price patterns, indicators, etc. I mainly use it for getting an idea of what price patterns that I watch are currently happening. I use it on 15 minute charts mainly during RTH.
It is very simple to add your own tests to this dashboard.
To add a new line to the plots, just copy one of the other plots, create the test, set the color for plot, and the title. Then make sure the TotalPlots value is the same number as the number of plots below.
If you do not want to see one of the plots, then just set its surrounding “If” statement to False.
You can place this in the same window with other plots like price, but you will the set the PlotMaxHeight value below to something low like 20.
Source: here
Author: Justintime
Screenshots
Indicator / Formula
/*
Visual Indicator Dashboard
--------------------------
This dashboard is useful for showing the current state of any test you might like to check for in relation to price patterns, indicators, etc.
I mainly use it for getting an idea of what price patterns that I watch are currently happening.
I use it on 15 minute charts mainly during RTH.

It is very simple to add your own tests to this dashboard.

To add a new line to the plots, just copy one of the other plots, create the test, set the color for plot, and the title.
Then make sure the TotalPlots value is the same number as the number of plots below.

If you do not want to see one of the plots, then just set its surrounding "If" statement to False.

You can place this in the same window with other plots like price, but you will the set the PlotMaxHeight value below to something low like 20.
*/
Title = "Patterns: ";

WindowHeight = 100; // maximum virtual height of the window.
PlotMaxHeight = 100; // maximum height of plots in the virtual window.
TotalPlots = 12; // Set this value to equal the number of plots below. Can be seen on window title.
Spacer = 2; // The space between each plot.
OffColor = colorWhite; // Color when test is false.

BI = BarIndex();
Rng = H - L;

barHeight = PlotMaxHeight / TotalPlots;
barPos = 1;

// Setup symbol type
isForex = IIf( StrFind( Name(), ".COMP" ) OR StrFind( Name(), ".FXCM" ), True, False );
isForex2 = IIf( isForex AND StrFind( Name(), "JPY" ), True, False );
isFuturesCont = StrFind( Name(), "#" ) OR StrFind( Name(), "@" );

// Setup up some values used for the tests based on symbol type
roundAmt = 0.001; // how much round amount to use for counting ISB and OSB checks
DblBotTopTolerance = 0.15 * MA( Rng, 20 ); // how much +/- should be accepted when checking double top/bottom

if ( isForex )
{
    roundAmt = 0.00001;
    DblBotTopTolerance = 0.0001;
}
else
    if ( isForex2 )
    {
        roundAmt = 0.001;
        DblBotTopTolerance = 0.01;
    }
    else
        if ( Name() == "@ES#" )
        {
            roundAmt = 0.0;
            DblBotTopTolerance = 0.0;
        }
        else
            if ( Name() == "@YM#" )
            {
                roundAmt = 0;
                DblBotTopTolerance = 1;
            }
            else
                if ( Name() == "@TFS#" )
                {
                    roundAmt = 0.1;
                    DblBotTopTolerance = 0.1;
                }

// Standard Plot Function
function PlotIndicator( barHeight, barPos, spacer, barTest, barColor, indiTitle )
{
    Plot( barHeight * barPos, indiTitle, IIf( barTest, barColor, OffColor ), styleOwnScale | styleArea | styleNoLabel | styleNoTitle, 0, WindowHeight, 0, -1 );
    Plot( barHeight + spacer, "", colorWhite, styleOwnScale | styleArea | styleNoLabel | styleNoTitle, 0, 100, 0, -1 );
    Title = Title + EncodeColor( barColor ) + "(P" + NumToStr( barPos, 1.0, False ) + "=" + indiTitle + ")" + EncodeColor( colorBlack );
}

/*
Plot Setups
-----------
To add a new line to the plots, just copy one of the other plots, create the test, set the color for plot, and the title.
Then make sure the TotalPlots value is the same number as the number of plots below.
*/

// NR7 Plot - this bar is more narrow than the last 7 bars
if ( True )
{
    barTest = Rng < Ref( LLV( Rng, 7 ), -1 ) AND BI < LastValue( BI );
    PlotIndicator( barHeight, barPos, spacer, barTest, colorBlue, "NR7" );
    barPos = barPos + 1;
}

// NR4 Plot - this bar is more narrow than the last 4 bars
if ( True )
{
    barTest = Rng < Ref( LLV( Rng, 4 ), -1 ) AND BI < LastValue( BI );
    PlotIndicator( barHeight, barPos, spacer, barTest, colorLightBlue, "NR4" );
    barPos = barPos + 1;
}

// 4 Down Closes Plot
if ( True )
{
    barTest = C < Ref( C, -1 ) AND Ref( C, -1 ) < Ref( C, -2 ) AND Ref( C, -2 ) < Ref( C, -3 ) AND Ref( C, -3 ) < Ref( C, -4 ) AND BI < LastValue( BI );
    PlotIndicator( barHeight, barPos, spacer, barTest, ColorRGB( 100, 0, 0 ), "4 Down" );
    barPos = barPos + 1;
}

// 3 Down Closes Plot
if ( True )
{
    barTest = C < Ref( C, -1 ) AND Ref( C, -1 ) < Ref( C, -2 ) AND Ref( C, -2 ) < Ref( C, -3 ) AND BI < LastValue( BI );
    PlotIndicator( barHeight, barPos, spacer, barTest, ColorRGB( 200, 0, 0 ), "3 Down" );
    barPos = barPos + 1;
}

// 4 Up Closes Plot
if ( True )
{
    barTest = C > Ref( C, -1 ) AND Ref( C, -1 ) > Ref( C, -2 ) AND Ref( C, -2 ) > Ref( C, -3 ) AND Ref( C, -3 ) > Ref( C, -4 ) AND BI < LastValue( BI );
    PlotIndicator( barHeight, barPos, spacer, barTest, ColorRGB( 100, 100, 0 ), "4 Up" );
    barPos = barPos + 1;
}

// 3 Up Closes Plot
if ( True )
{
    barTest = C > Ref( C, -1 ) AND Ref( C, -1 ) > Ref( C, -2 ) AND Ref( C, -2 ) > Ref( C, -3 ) AND BI < LastValue( BI );
    PlotIndicator( barHeight, barPos, spacer, barTest, ColorRGB( 200, 200, 0 ), "3 Up" );
    barPos = barPos + 1;
}

// Inside Bar Plot
if ( True )
{
    barTest = L >= Ref( L, -1 ) - roundAmt AND H <= Ref( H, -1 ) + roundAmt AND BI < LastValue( BI );
    PlotIndicator( barHeight, barPos, spacer, barTest, colorOrange, "ISB" );
    barPos = barPos + 1;
}

// Outside Bar Plot
if ( True )
{
    barTest = L <= Ref( L, -1 ) + roundAmt AND H >= Ref( H, -1 ) - roundAmt;
    PlotIndicator( barHeight, barPos, spacer, barTest, colorLightOrange, "OSB" );
    barPos = barPos + 1;
}

// Wide Bar Plot
if ( True )
{
    barTest = Rng > Ref( MA( Rng, 100 ), -1 ) * 2;
    PlotIndicator( barHeight, barPos, spacer, barTest, ColorRGB( 100, 200, 0 ), "WRB" );
    barPos = barPos + 1;
}

// Double Bottom Plot
if ( True )
{
    barTest = C > Ref( H, -1 ) AND Ref( C, -1 ) > Ref( O, -1 ) AND Ref( C, -2 ) < Ref( O, -2 ) AND Ref( L, -2 ) < Ref( L, -3 ) AND Ref( L, -1 ) <= Ref( L, -2 ) + DblBotTopTolerance AND Ref( L, -1 ) >= Ref( L, -2 ) - DblBotTopTolerance;
    PlotIndicator( barHeight, barPos, spacer, barTest, ColorRGB( 0, 200, 200 ), "DblB" );
    barPos = barPos + 1;
}

// Double Top Plot
if ( True )
{
    barTest = C < Ref( L, -1 ) AND Ref( C, -1 ) < Ref( O, -1 ) AND Ref( C, -2 ) > Ref( O, -2 ) AND Ref( H, -2 ) > Ref( H, -3 ) AND Ref( H, -1 ) <= Ref( H, -2 ) + DblBotTopTolerance AND Ref( H, -1 ) >= Ref( H, -2 ) - DblBotTopTolerance;
    PlotIndicator( barHeight, barPos, spacer, barTest, ColorRGB( 0, 150, 150 ), "DblT" );
    barPos = barPos + 1;
}

// Last Bar Plot - shows the position of last bar index for viewing reference
if ( True )
{
    barTest = BI == LastValue( BI );
    PlotIndicator( barHeight, barPos, spacer, barTest, ColorRGB( 100, 100, 100 ), "Last" );
    barPos = barPos + 1;
}
0 comments
Leave Comment
Please login here to leave a comment.