Debdulal And Soumya for Amibroker (AFL)
siivaramm almost 16 years ago Amibroker (AFL)
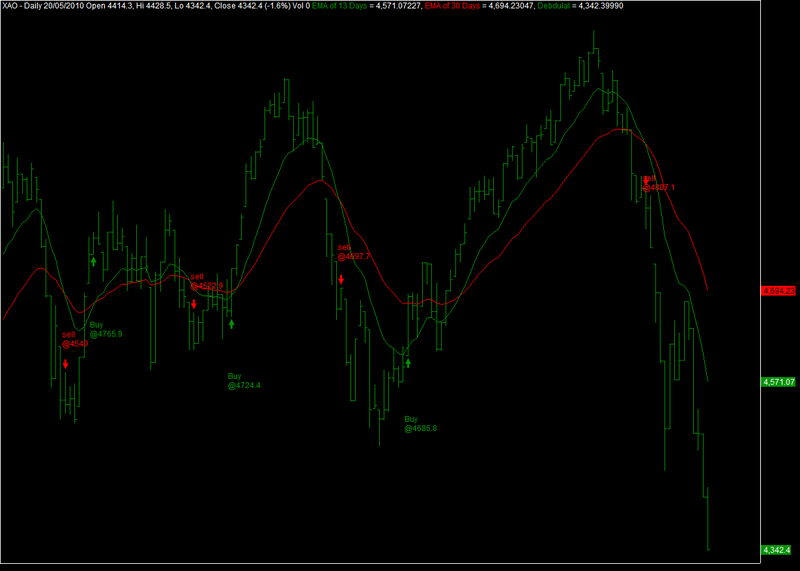
Buy And Sell signals based on the crossing of EMA’S
Screenshots
Indicator / Formula
Copy & Paste Friendly
_SECTION_BEGIN("debdulal");
//Title="Indicator Developed and Conceptualised by Debdulal And Soumya";

SetChartOptions(0,chartShowArrows|chartShowDates);
_N(Title = StrFormat("{{NAME}} - {{INTERVAL}} {{DATE}} Open %g, Hi %g, Lo %g, Close %g (%.1f%%) Vol " +
WriteVal( V, 1.0 ) +" {{VALUES}}",
O, H, L, C, SelectedValue( ROC( C, 1 )) ));

// This part will plot the EMA value And type of user choice

EMAstyle=ParamStyle("MAType",styleLine,maskAll );
LTEMAcolor=ParamColor("LT EMA Colour" ,colorRed);
STEMAcolor=ParamColor("ST EMA Colour",colorGreen);
LTEMAPeriod=Param("LTEMA Period",30);
STEMAPeriod=Param("STEMA Period",13);
Plot(EMA(Close,STEMAPeriod),"EMA of "+STEMAPeriod+" Days" , STEMAcolor, EMAstyle, Null, Null );
Plot(EMA(Close,LTEMAPeriod), "EMA of "+LTEMAPeriod+" Days", LTEMAcolor, EMAstyle, Null, Null );
//Plot(SAR(.02,.2),"SAR",colorBlue,maskAll,Null,Null);

// This part will plot Closing price with barstyle choosen by user

ChartStyl=ParamStyle("Chart Type", styleBar,maskAll );
Chartcolor=ParamColor("Chart Colour",colorGreen);
Plot(Close,"Debdulal",Chartcolor,ChartStyl);

// This part will find the buy and sell point in the chart

SellTRIGGER=MACD(12,26)<= Signal(12,26,9);
Buy=Cross(MACD(12,26),Signal(12,26,9));
Sell=(EMA(Close,LTEMAperiod)>EMA(Close,STEMAperiod)) AND SellTRIGGER;

//Buy= MACD(12,26)>=Signal(12,26,9);
//Sell=MACD(12,26)<Signal(12,26,9);
//Sell=Cross(EMA(Open,Operiod),EMA(Close,Cperiod))AND MACD(12,26)<Signal(12,26,9);

Buy     = ExRem(Buy, Sell);
Sell    = ExRem(Sell, Buy);
Signalshape=Buy*shapeUpArrow + Sell*shapeDownArrow;
PlotShapes( Signalshape, IIf( Buy, colorGreen, colorRed ),0, IIf( Buy, Low, High ) );
pos = 1.5*ATR(15);
for( i = 0; i < BarCount; i++ ) {
       if( Buy[i] ) PlotText( "Buy\n@" + Close[i], i, Low[i] - pos[i], colorGreen );
       if( Sell[i] ) PlotText( "sell\n@" + Close[i], i, Low[i] + pos[i], colorRed );
	}
_SECTION_END();
0 comments
Leave Comment
Please login here to leave a comment.