Trading Trix bars for Amibroker (AFL)
antonioleg almost 16 years ago Amibroker (AFL)
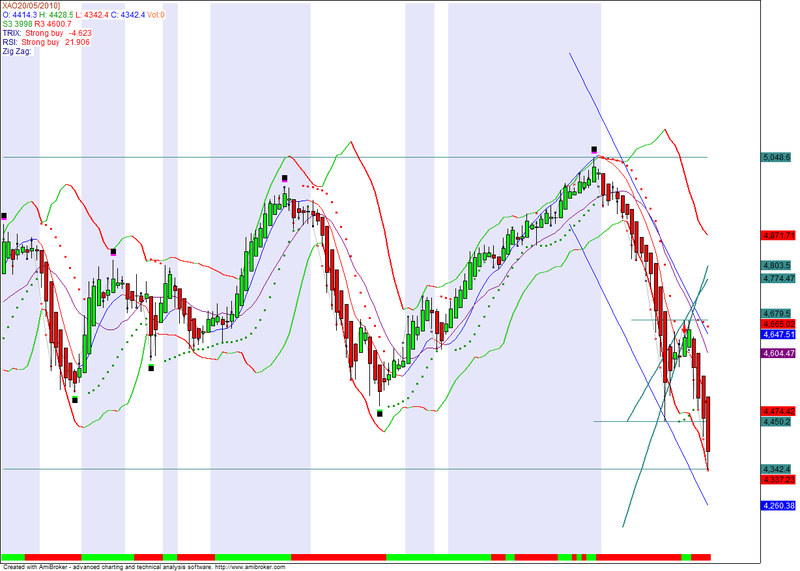
Trix based system with support and resistance lines. The indicator also display pivots and the parabolic SAR
Screenshots
Indicator / Formula
Copy & Paste Friendly
_SECTION_BEGIN("Candle");
SetBarsRequired(200,0);
GraphXSpace = 5;
SetChartOptions(0,chartShowArrows|chartShowDates);
k =  Optimize("K",Param("K",1,0.25,5,0.25),0.25,5,0.25);
Per= Optimize("atr",Param("atr",4,3,20,1),3,20,1);
HACLOSE=(O+H+L+C)/4;
HaOpen = AMA( Ref( HaClose,  -1 ),  0.5 );
HaHigh = Max( H,  Max( HaClose,  HaOpen ) );
HaLow = Min( L,  Min( HaClose,  HaOpen ) );
PlotOHLC( HaOpen, HaHigh, HaLow, HaClose, "" + Name(), colorBlack, styleCandle | styleNoLabel );
j=Haclose;
_SECTION_END();

_SECTION_BEGIN("Advanced Support & Resistance");
SetChartOptions(0,chartShowArrows|chartShowDates);
_N(Title = StrFormat("{{NAME}} - {{INTERVAL}} {{DATE}} ,{{VALUES}}", O, H, L, C, SelectedValue( ROC( C, 1 ) ) ));
//Plot(C, "", IIf(O>=C, colorRed, colorBlue),styleCandle);

//SetChartBkGradientFill( ParamColor("Inner panel upper",colorBlack),ParamColor("Inner panel lower",colorBlack));
_N(Title = EncodeColor(colorWhite)+StrFormat(" {{NAME}} - {{INTERVAL}} {{DATE}} Open:%g, Close:%g ,{{VALUES}}",O,C ));

////////////////////////////////////////////////////////

//Plot(MA(C,15),"",colorViolet);
////////////////////////////////////////////////////////

per1=Param ("per1", 0.1,0.1,50,0.10);

per=per1;
x = Cum(1);
s1=L;
s11=H;
pS = TroughBars( s1, per, 1 ) == 0;
endt= SelectedValue(ValueWhen( pS, x, 1 ));
startt=SelectedValue(ValueWhen( pS, x, 2 ));
dtS =endt-startt;
endS = SelectedValue(ValueWhen( pS, s1, 1 ) );
startS = SelectedValue( ValueWhen( pS, s1, 1 ));
aS = (endS-startS)/dtS;
bS = endS;
trendlineS = aS * ( x -endt ) + bS;
g3= IIf(x>startt-10,trendlineS,-1e10);
//Plot(g3,"",colorRed,styleDots,styleThick);
Plot(g3,"",colorTeal,styleThick);

pR = PeakBars( s11, per, 1 ) == 0;
endt1= SelectedValue(ValueWhen( pR, x, 1 ));
startt1=SelectedValue(ValueWhen( pR, x, 2 ));
dtR =endt1-startt1;
endR = SelectedValue(ValueWhen( pR, s11, 1 ) );
startR = SelectedValue( ValueWhen( pR, s11, 1 ));
aR = (endR-startR)/dtR;
bR = endR;
trendlineR = aR * ( x -endt1 ) + bR;
g4= IIf(x>startT1-10,trendlineR,-1e10);
//Plot(g4,"",colorGreen,styleDots,styleThick);
Plot(g4,"",colorTeal,styleThick);

///////////////////////////////////////////////////////////////
perc=per1;
x=BarIndex();xx=SelectedValue(x);
t1=SelectedValue(ValueWhen(PeakBars(C,perc)==0,x)) ;
H1=SelectedValue(ValueWhen(PeakBars(C,perc)==0,C)) ;
t11=SelectedValue(ValueWhen(TroughBars(C,perc)==0, x));
H11=SelectedValue(ValueWhen(TroughBars(C,perc)==0, C));
g=t1>t11;
shape=IIf(g,shapeDownArrow*(x==t1),shapeUpArrow*(x ==t11));
Color=IIf(g,colorRed,colorGreen);
PlotShapes(shape,color);
//////////////////////////////////////////////////////////

per=per1;

x = Cum(1);
s1=C;
s11=C;
pS = TroughBars( s1, per, 1 ) == 0;
endt= SelectedValue(ValueWhen( pS, x, 1 ));
startt=SelectedValue(ValueWhen( pS, x, 2 ));
dtS =endt-startt;
endS = SelectedValue(ValueWhen( pS, s1, 1 ) );
startS = SelectedValue( ValueWhen( pS, s1, 2 ));
aS = (endS-startS)/dtS;
bS = endS;
trendlineS = aS * ( x -endt ) + bS;
g3= IIf(x>startt-10,trendlineS,-1e10);
Plot(g3,"",colorTeal,styleThick);

pR = PeakBars( s11, per, 1 ) == 0;
endt1= SelectedValue(ValueWhen( pR, x, 1 ));
startt1=SelectedValue(ValueWhen( pR, x, 2 ));
dtR =endt1-startt1;
endR = SelectedValue(ValueWhen( pR, s11, 1 ) );
startR = SelectedValue( ValueWhen( pR, s11, 2 ));
aR = (endR-startR)/dtR;
bR = endR;
trendlineR = aR * ( x -endt1 ) + bR;
g4= IIf(x>startT1-10,trendlineR,-1e10);
Plot(g4,"",colorTeal,styleThick);
_SECTION_END();

_SECTION_BEGIN("Volume");
Plot( Volume, _DEFAULT_NAME(), ParamColor("Color", colorBlue ), styleNoTitle | ParamStyle( "Style", styleHistogram | styleOwnScale | styleThick | styleNoLabel, maskHistogram  ), 2 );
_SECTION_END();

_SECTION_BEGIN("Zig zag trend");
//z_ZigZagValid
// ******** CHARTING
Plot(MA(C,15),"",colorViolet);

per=Param ("per1", 0.325,0.1,50,0.10);

PercentChange = per;
mystartbar = SelectedValue(BarIndex()); // FOR GRAPHING

mystartbardate = LastValue(ValueWhen(mystartbar == BarIndex(), DateNum(),1));

InitialValue = LastValue(ValueWhen(mystartbardate == DateNum(), C , 1 ) ) ;
Temp1 = IIf(BarIndex() >= mystartbar, InitialValue, Null) ;
//Plot(Temp1, " ", colorBlack,styleLine);
//Plot((1+(LastValue(PercentChange)/100))*(Temp1), " ", colorRed, styleLine) ;
//Plot((1-(LastValue(PercentChange)/100))*(Temp1), " ", colorGreen, styleLine) ;

ZZ = Zig(C,LastValue(PercentChange)) ;
PivotLow = Ref(IIf(Ref(ROC(ZZ,1),-1) < 0 AND ROC(ZZ,1) > 0, 1, Null),1);
PivotHigh = Ref(IIf(Ref(ROC(ZZ,1),-1) > 0 AND ROC(ZZ,1) < 0, 1, Null),1);

//PlotShapes( shapeCircle*PivotLow, colorRed,0, L, -20) ;
//PlotShapes( shapeCircle*PivotHigh,colorGreen,0,H, 20) ;

Buy_Valid = IIf(C>(1+(LastValue(PercentChange)/100))*(ValueWhen(PivotLow, C,1))
AND ROC(ZZ,1) > 0,1,0);
Sell_Valid = IIf(C<(1-(LastValue(PercentChange)/100))*(ValueWhen(PivotHigh, C,1))
AND ROC(ZZ,1) < 0,1,0);

Buy_Valid = ExRem(Buy_Valid,Sell_Valid);
Sell_Valid = ExRem(Sell_Valid,Buy_Valid);

//PlotShapes( shapeUpArrow*Buy_Valid, colorRed,0, L, -20);
//PlotShapes( shapeDownArrow*Sell_Valid, colorGreen,0,H, -20) ;

BarColors =
IIf(BarsSince(Buy_Valid) < BarsSince(Sell_Valid)
AND BarsSince(Buy_Valid)!=0, colorGreen,
IIf(BarsSince(Sell_Valid) < BarsSince(Buy_Valid)
AND BarsSince(Sell_Valid)!=0, colorRed, colorDarkTeal));

//Plot(C, " ", BarColors, styleCandle ) ;
//Plot(ZZ," ", colorLightGrey,styleLine|styleThick);
//Plot(ZZ," ", BarColors,styleDots|styleLine);
Plot(ZZ," ", colorLightGrey,styleLine|styleNoLabel);
Plot(ZZ," ", BarColors,styleDots|styleLine|styleNoLabel);
Title = Name() + " " + Date() + WriteIf(PivotLow, " Up Pivot","")+WriteIf(PivotHigh," Down Pivot ","")+ WriteIf(Buy_Valid, " Buy Point ","") + WriteIf(Sell_Valid, " Sell Point ", "") ;
_SECTION_END();

//_SECTION_BEGIN("MACD Trend Bars");
//ShortPds = Param("Fast period", 12, 1, 50, 1 );
//LongPds  = Param("Slow period", 26, 3, 50, 1 );
//aperiod  = Param("Signal period", 9, 1, 30, 1 );
//ml = MACD( ShortPds, LongPds );
//sl = Signal(ShortPds, LongPds,aperiod);
//InsideMacd = 	(sl < Ref(sl , -1) AND
//				ml  > Ref(ml, -1)) OR
//				(sl > Ref(sl , -1) AND
//				ml  < Ref(ml, -1));
//Color = IIf( InsideMacd, ParamColor("Inside bar", colorPlum), IIf(sl > ml, ParamColor("down bar", colorRed), ParamColor("up bar", colorGreen)));
//Plot(1, "", Color, styleOwnScale|styleArea|styleNoLabel, -0.5,100);
//_SECTION_END();

_SECTION_BEGIN("Trix bars");
//	Trix Bars number
//	Trix Bars number for each swing

periods = Param( "Periods", 9, 3, 13, 2 );
//periods = Param( "Periods", 5, 2, 200, 1 );
TrixOnClose = Trix( periods );

uptx = TrixOnClose >= Ref( TrixOnClose, -1 );
dntx = TrixOnClose <= Ref( TrixOnClose, -1 );

Peaktrix = TrixOnClose > Ref( TrixOnClose, -1 )AND TrixOnClose > Ref(TrixOnClose, 1 );
Troughtrix = TrixOnClose < Ref( TrixOnClose, -1 )AND TrixOnClose < Ref(TrixOnClose, 1 ) ;

BarsUp = BarsSince( dntx );
BarsDn = BarsSince( uptx );

Colortx = IIf( uptx , colorGreen, IIf( dntx , colorRed, colorGreen ) );
//Plot( TrixOnClose, "Trix (" + periods + ")" , Colortx, styleThick );

// Trix's ribbon
Ribbon = IIf( uptx , colorBrightGreen, IIf( dntx , colorRed, colorBrightGreen ));
Plot( 1, "", Ribbon , styleOwnScale | styleArea | styleNoLabel, 0, 100 );
_SECTION_END();

_SECTION_BEGIN("Indicatori");
// Supporto e Resistenza
p = (H+L+C)/3;
r1 = (2*p)-L;
s1 = (2*p)-H;
r2 = p +(r1 - s1);
s2 = p -(r2 - s1);
r3 = P + (r2 - s2);
s3 = p - (r3 - s2);

//TRIX
trx=0;
trxh = 0;
periods = Param( "Periods", 9, 3, 13, 2 );
//periods = Param( "Periods", 5, 2, 200, 1 );
trx=Trix(periods);
trxh=C/100;

//under study
tx=(Trix(3)*Trix(5)*Trix(7))/100;
tm=MA(tx,3);
Ch1=tx - tm;

//RSI & Zig Zag
p = Param("Periods", 14, 2, 200, 1 );
r = RSI( p );

ZZ = Zig(C,LastValue(PercentChange)) ;
PivotLow = Ref(IIf(Ref(ROC(ZZ,1),-1) < 0 AND ROC(ZZ,1) > 0, 1, Null),1);
PivotHigh = Ref(IIf(Ref(ROC(ZZ,1),-1) > 0 AND ROC(ZZ,1) < 0, 1, Null),1);


Title = EncodeColor(colorBrown)+ Name () + EncodeColor(colorBrown)+ Date () + EncodeColor(colorBrown)+"]"+"\n"+

EncodeColor(colorBlue)+"O: "+EncodeColor(colorBlue)+O+
EncodeColor(colorGreen)+" H: "+EncodeColor(colorGreen)+H+
EncodeColor(colorRed)+" L: "+EncodeColor(colorRed)+L+
EncodeColor(colorBlue)+" C: "+EncodeColor(colorBlue)+C+
EncodeColor(colorOrange)+" Vol:"+EncodeColor(colorOrange)+WriteVal(V,1,0)+"\n"+

//EncodeColor(colorGreen)+" s1 "+EncodeColor(colorGreen)+s1+"\n"+
//EncodeColor(colorGreen)+" s2 "+EncodeColor(colorGreen)+s2+"\n";
EncodeColor(colorGreen)+"S3 "+EncodeColor(colorGreen)+s3+

//EncodeColor(colorRed)+" r1 "+EncodeColor(colorRed)+r1+
//EncodeColor(colorRed)+" r2 "+EncodeColor(colorRed)+r2+
EncodeColor(colorRed)+" R3 "+EncodeColor(colorRed)+r3+"\n"+

EncodeColor(colorDarkBlue)+"TRIX: "+WriteIf(trx > Ref(trx ,-1) AND trx < trxh ,EncodeColor(colorRed)+" Buy ",WriteIf( trx < Ref(trx ,-1) AND trx < 0 ,EncodeColor(colorRed)+" Strong buy ",WriteIf( trx > Ref(trx ,-1) AND trx > trxh ,EncodeColor(colorGreen)+" strong sell ", EncodeColor(colorGreen)+" Sell " )))+
EncodeColor(colorDarkBlue)+WriteIf(trx > trxh OR trx < 0 ,EncodeColor(colorRed)+WriteVal(trx), EncodeColor(colorBlue)+WriteVal(trx))+"\n"+

EncodeColor(colorDarkBlue)+"RSI: "+ WriteIf(r > Ref(r ,-1) AND r < 30 AND r > 70 ,EncodeColor(colorRed)+" Buy ",WriteIf( r < Ref(r ,-1) AND r < 30 ,EncodeColor(colorRed)+" Strong buy ",WriteIf( r > Ref(r ,-1) AND r > 70 ,EncodeColor(colorGreen)+" Strong sell ", EncodeColor(colorGreen)+" Sell " )))+
EncodeColor(colorDarkBlue)+WriteIf(r > 70 OR r < 30 ,EncodeColor(colorRed)+WriteVal(r), EncodeColor(colorBlue)+WriteVal(r))+"\n"+

EncodeColor(colorDarkBlue)+"Zig Zag: "+ WriteIf(PivotLow, " line up","")+WriteIf(PivotHigh," line down ","")+ WriteIf(Buy_Valid, " buy point ","") + WriteIf(Sell_Valid, " sell point ", "");

//EncodeColor(colorPlum) + WriteIf(InsideMacd," ","" ) + EncodeColor(colorGreen) + WriteIf(sl>ml,"Rialzo","") + EncodeColor(colorRed) + WriteIf(sl<ml,"Ribasso","" );
Ribbon = IIf( uptx , colorBrightGreen, IIf( dntx , colorRed, colorBrightGreen ));
Plot( 1, "", Ribbon , styleOwnScale | styleArea | styleNoLabel, 0, 100 );

//Color = IIf( InsideMacd, ParamColor("Inside bar", colorPlum), IIf(sl > ml, ParamColor("down bar", colorRed), ParamColor("up bar", colorGreen)));
//Plot(1, "", Color, styleOwnScale|styleArea|styleNoLabel, -0.5,100);
//EncodeColor(colorPlum) + WriteIf(TSU,"tendenza al rialzo","" ) + EncodeColor(colorIndigo) + WriteIf(TSD,"tendenza al ribasso","" )+"\n"+

_SECTION_END();

_SECTION_BEGIN("Trend mobile");
N = 30; // Periodo - in questo caso un mese ma si può fare una settimana, 1 ora, 15 minuti, ecc...
Start = 1;
X = Cum(Start); // Set up the x cordinate array of the Linear Regression Line
Y = Avg; // Set the y co-ordinate of the Linear Regression line
/* Calculate the slope (bconst) AND the y intercept (aconst) of the line */
SUMX = LastValue(Sum(X,N));
SUMY = LastValue(Sum(Y,N));
SUMXY = LastValue(Sum(X*Y,N));
SUMXSqd = LastValue(Sum(X*X,N));
SUMSqdX = LastValue(SUMX * SUMX);
bconst = (N * SUMXY - SUMX * SUMY)/(N * SUMXSqd - SUMSqdX);
aconst = (SUMY - bconst * (SUMX))/N;
/* Force the x value to be very negative so the graph does not apear before the lookback period */
Domain = IIf ( X > LastValue(X) - N, 1 , -1e10);
Xvar = X * Domain;
/* Linear Regression Line */
Yvar = aconst + bconst * Xvar;
/* Plot the graphs */
/* Linear Regression Lines */
Colore=colorBlue;
//Plot(Yvar,"Pivot",colorWhite);
Plot(Yvar + LastValue(StDev(High,N))," trend_up",colorBlue);
Plot(Yvar - LastValue(StDev(Low,N))," trend_down",colorBlue);
_SECTION_END();

_SECTION_BEGIN("Parabolic Sar");
accel = Param("Acceleration", 0.02, 0, 1, 0.001);
mx = Param("Max. acceleration", 0.2, 0, 1, 0.001);

Psar = SAR(accel,mx);

colordots = IIf(Psar < L,colorGreen,IIf(Psar > H,colorRed,colorWhite));

Buy = Cross(C,Psar); Buy = Ref(Buy,-1); BuyPrice = L;
Sell = Cross(Psar,C); Sell = Ref(Sell,-1); SellPrice = H;

SetBarsRequired(-2,-2);
SetChartOptions(0, chartShowDates);
 Plot(Psar ,"\nPsar",colordots,styleDots|styleNoLine);

//PlotShapes(IIf(Buy,shapeUpArrow,shapeNone),colorRed,0,L,-35);
//PlotShapes(IIf(Buy,shapeHollowUpArrow,shapeNone),colorRed,0,L,-35);
//PlotShapes(IIf(Buy,shapeHollowCircle,shapeNone),colorBlue,0,BuyPrice,0);

//PlotShapes(IIf(Sell,shapeDownArrow,shapeNone),colorBrightGreen,0,H,-35);
//PlotShapes(IIf(Sell,shapeHollowDownArrow,shapeNone),colorBrightGreen,0,H,-35);
//PlotShapes(IIf(Sell,shapeHollowCircle,shapeNone),colorOrange,0,SellPrice,0);

_SECTION_END();

_SECTION_BEGIN("Pivot");
nBars = Param("Number of bars", 30, 5, 40);
LP=Param("LookBack Period",250,1,500,1);
bShowTCZ = Param("Show TCZ", 0, 0, 1);
nExploreBarIdx = 0;
nExploreDate = 0;
nCurDateNum = 0;
DN = DateNum();
DT = DateTime();
bTCZLong = False;
bTCZShort = False;
nAnchorPivIdx = 0;
ADX14 = ADX(14);
if(Status("action")==1) {
	bDraw = True;
	bUseLastVis = 1;
} else {
	bDraw = False;
	bUseLastVis = False;
	bTrace = 1;
	nExploreDate = Status("rangetodate");
	for (i=LastValue(BarIndex());i>=0;i--) {
		nCurDateNum = DN[i];
		if (nCurDateNum == nExploreDate) {
			nExploreBarIdx = i;
		}
	}
}
GraphXSpace=7;
if (bDraw) {
}
aHPivs = H - H;
aLPivs = L - L;
aHPivHighs = H - H;
aLPivLows = L - L;
aHPivIdxs = H - H;
aLPivIdxs = L - L;
aAddedHPivs = H - H;
aAddedLPivs = L - L;
aLegVol = H - H;
aRetrcVol = H - H;
nHPivs = 0;
nLPivs = 0;
lastHPIdx = 0;
lastLPIdx = 0;
lastHPH = 0;
lastLPL = 0;
curPivBarIdx = 0;
aHHVBars = HHVBars(H, nBars);
aLLVBars = LLVBars(L, nBars);
aHHV = HHV(H, nBars);
aLLV = LLV(L, nBars);
nLastVisBar = LastValue(
	Highest(IIf(Status("barvisible"), BarIndex(), 0)));
curBar = IIf(nlastVisBar > 0 AND bUseLastVis, nlastVisBar,
	IIf(Status("action")==4 AND nExploreBarIdx > 0, nExploreBarIdx,
	LastValue(BarIndex())));
curTrend = "";
if (aLLVBars[curBar] < aHHVBars[curBar])
	curTrend = "D";
else
	curTrend = "U";
if (curBar >= LP) {
	for (i=0; i<LP; i++) {
		curBar = IIf(nlastVisBar > 0 AND bUseLastVis,
			nlastVisBar-i,
			IIf(Status("action")==4 AND nExploreBarIdx > 0,
			nExploreBarIdx-i,
			LastValue(BarIndex())-i));
		if (aLLVBars[curBar] < aHHVBars[curBar]) {
			if (curTrend == "U") {
				curTrend = "D";
				curPivBarIdx = curBar - aLLVBars[curBar];
				aLPivs[curPivBarIdx] = 1;
				aLPivLows[nLPivs] = L[curPivBarIdx];
				aLPivIdxs[nLPivs] = curPivBarIdx;
				nLPivs++;
			}
		} else {
			if (curTrend == "D") {
				curTrend = "U";
				curPivBarIdx = curBar - aHHVBars[curBar];
				aHPivs[curPivBarIdx] = 1;
				aHPivHighs[nHPivs] = H[curPivBarIdx];
				aHPivIdxs[nHPivs] = curPivBarIdx;
				nHPivs++;
			}
		}
	}
}
curBar =
	IIf(nlastVisBar > 0 AND bUseLastVis,
	nlastVisBar,
	IIf(Status("action")==4 AND nExploreBarIdx > 0,
	nExploreBarIdx,
	LastValue(BarIndex()))
	);
if (nHPivs >= 2 AND nLPivs >= 2) {
	lastLPIdx = aLPivIdxs[0];
	lastLPL = aLPivLows[0];
	lastHPIdx = aHPivIdxs[0];
	lastHPH = aHPivHighs[0];
	nLastHOrLPivIdx = Max(lastLPIdx, lastHPIdx);
	nAddPivsRng = curBar - nLastHOrLPivIdx;
	aLLVAfterLastPiv = LLV(L, nAddPivsRng);
	nLLVAfterLastPiv = aLLVAfterLastPiv[curBar];
	aLLVIdxAfterLastPiv = LLVBars(L, nAddPivsRng);
	nLLVIdxAfterLastPiv = curBar - aLLVIdxAfterLastPiv[curBar];
	aHHVAfterLastPiv = HHV(H, nAddPivsRng);
	nHHVAfterLastPiv = aHHVAfterLastPiv[curBar];
	aHHVIdxAfterLastPiv = HHVBars(H, nAddPivsRng);
	nHHVIdxAfterLastPiv = curBar - aHHVIdxAfterLastPiv[curBar];
	if (lastHPIdx > lastLPIdx) {

		/*	There are at least two possibilities here. One is that
	   		the previous high was higher, indicating that this is a
	   		possible short retracement or one in the making.
	   		The other is that the previous high was lower, indicating
	   		that this is a possible long retracement in the working.
			However, both depend on opposing pivots. E.g., if I find
			higher highs, what if I have lower lows?

			If the highs are descending, then I can consider:
	   			- a lower low, and leave it at that
	   			- a higher high and higher low
	   			- a lower low and another lower high
		*/
		if (aHPivHighs[0] < aHPivHighs[1]) {

			if (nLLVAfterLastPiv < aLPivLows[0] AND
				(nLLVIdxAfterLastPiv - lastHPIdx - 1) >= 1
				AND nLLVIdxAfterLastPiv != curBar	) {

				// -- OK, we'll add this as a pivot.
				//    Mark it for plotting...
				aLPivs[nLLVIdxAfterLastPiv] = 1;
				aAddedLPivs[nLLVIdxAfterLastPiv] = 1;

				//    ...and then rearrange elements in the
				//    pivot information arrays
				for (j=0; j<nLPivs; j++) {
					aLPivLows[nLPivs-j] = aLPivLows[nLPivs-(j+1)];
					aLPivIdxs[nLPivs-j] = aLPivIdxs[nLPivs-(j+1)];
				}
				aLPivLows[0] = nLLVAfterLastPiv;
				aLPivIdxs[0] = nLLVIdxAfterLastPiv;
				nLPivs++;

			// -- Test whether to add piv given last piv is high
			//    AND we have lower highs
			}

		// -- Here, the last piv is a high piv, and we have
		//    higher-highs. The most likely addition is a
		//    Low piv that is a retracement.
		} else {

			if (nLLVAfterLastPiv > aLPivLows[0] AND
				(nLLVIdxAfterLastPiv - lastHPIdx - 1) >= 1
				AND nLLVIdxAfterLastPiv != curBar	) {

				// -- OK, we'll add this as a pivot.
				//    Mark it for plotting...
				aLPivs[nLLVIdxAfterLastPiv] = 1;
				aAddedLPivs[nLLVIdxAfterLastPiv] = 1;

				//    ...and then rearrange elements in the
				//    pivot information arrays
				for (j=0; j<nLPivs; j++) {
					aLPivLows[nLPivs-j] = aLPivLows[nLPivs-(j+1)];
					aLPivIdxs[nLPivs-j] = aLPivIdxs[nLPivs-(j+1)];
				}
				aLPivLows[0] = nLLVAfterLastPiv;
				aLPivIdxs[0] = nLLVIdxAfterLastPiv;
				nLPivs++;

			// -- Test whether to add piv given last piv is high
			//    AND we have lower highs
			}
		// -- The last piv is a high and we have higher highs
		//    OR lower highs
		}

	/* ****************************************************************
		Still finding missed pivot(s). Here, the last piv is a low piv.
	**************************************************************** */
	} else {

		// -- First case, lower highs
		if (aHPivHighs[0] < aHPivHighs[1]) {

			if (nHHVAfterLastPiv < aHPivHighs[0] AND
				(nHHVIdxAfterLastPiv - lastLPIdx - 1) >= 1
				AND nHHVIdxAfterLastPiv != curBar	) {

				// -- OK, we'll add this as a pivot.
				//    Mark that for plotting
				aHPivs[nHHVIdxAfterLastPiv] = 1;
				aAddedHPivs[nHHVIdxAfterLastPiv] = 1;

				//    ...and then rearrange elements in the
				//    pivot information arrays
				for (j=0; j<nHPivs; j++) {
					aHPivHighs[nHPivs-j] = aHPivHighs[nHPivs-(j+1)];
					aHPivIdxs[nHPivs-j] = aHPivIdxs[nhPivs-(j+1)];
				}
				aHPivHighs[0] = nHHVAfterLastPiv;
				aHPivIdxs[0] = nHHVIdxAfterLastPiv;
				nHPivs++;

			// -- Test whether to add piv given last piv is high
			//    AND we have lower highs
			}

		// -- Second case when last piv is a low piv, higher highs
		//    Most likely addition is high piv that is a retracement.
		//    Considering adding a high piv as long as it is higher
		} else {

			// -- Where I have higher highs,
			if (nHHVAfterLastPiv > aHPivHighs[0] AND
				(nHHVIdxAfterLastPiv - lastLPIdx - 1) >= 1
				AND nHHVIdxAfterLastPiv != curBar	) {

				// -- OK, we'll add this as a pivot.
				//    Mark it for plotting...
				aHPivs[nHHVIdxAfterLastPiv] = 1;
				aAddedHPivs[nHHVIdxAfterLastPiv] = 1;

				//    ...and then rearrange elements in the
				//    pivot information arrays
				for (j=0; j<nHPivs; j++) {
					aHPivHighs[nHPivs-j] = aHPivHighs[nHPivs-(j+1)];
					aHPivIdxs[nHPivs-j] = aHPivIdxs[nhPivs-(j+1)];
				}
				aHPivHighs[0] = nHHVAfterLastPiv;
				aHPivIdxs[0] = nHHVIdxAfterLastPiv;
				nHPivs++;

			// -- Test whether to add piv given last piv is high
			//    AND we have lower highs
			}

		}

	}

// -- If there are at least two of each
}

/* ****************************************
// -- Done with finding pivots
***************************************** */

if (bDraw) {

	// -- OK, let's plot the pivots using arrows


PlotShapes( IIf(aHPivs==1, shapeSmallSquare, shapeNone), colorCustom12, layer = 0, yposition = High, offset = 9);
PlotShapes( IIf(aHPivs==1, shapeSmallSquare, shapeNone), colorBlack, layer = 0, yposition = High, offset = 12);

PlotShapes( IIf(aAddedHPivs==1, shapeSmallSquare, shapeNone), colorCustom10,layer = 0, yposition = High, offset = 9);
PlotShapes( IIf(aAddedHPivs==1, shapeSmallSquare, shapeNone), colorBlack, layer = 0, yposition = High, offset = 12);

PlotShapes( IIf(aLPivs==1, shapeSmallSquare, shapeNone), colorBrightGreen, layer = 0, yposition = Low, offset = -9);
PlotShapes( IIf(aLPivs==1, shapeSmallSquare, shapeNone), colorBlack, layer = 0, yposition = Low, offset = -12);

PlotShapes( IIf(aAddedLPivs==1, shapeSmallSquare, shapeNone), colorYellow, layer = 0, yposition = Low, offset = -10);
PlotShapes( IIf(aAddedLPivs==1, shapeSmallSquare, shapeNone), colorBlack, layer = 0, yposition = Low, offset = -13);
}


/* ****************************************
// -- Done with discovering and plotting pivots
***************************************** */

// -- I'm going to want to look for possible retracement
risk = 0;
profInc = 0;
nLeg0Pts = 0;
nLeg0Bars = 0;
nLeg0Vol = 0;
nLeg1Pts = 0;
nLeg1Bars = 0;
nLeg1Vol = 0;
nLegBarsDiff = 0;
nRtrc0Pts = 0;
nRtrc0Bars = 0;
nRtrc0Vol = 0;
nRtrc1Pts = 0;
nRtrc1Bars = 0;
nRtrc1Vol = 0;

minRtrc = 0;
maxRtrc = 0;
minLine = 0;
maxLine = 0;
triggerLine = 0;
firstProfitLine = 0;
triggerInc = 0;
triggerPrc = 0;
firstProfitPrc = 0;
retrcPrc = 0;
retrcBar = 0;
retrcBarIdx = 0;
retrcRng = 0;
aRetrcPrc = H-H;
aRetrcPrcBars = H-H;
aRetrcClose = C;
retrcClose = 0;

// -- Do TCZ calcs. Arrangement of pivs very specific
//    for this setup.
if (nHPivs >= 2 AND
	nLPivs >=2 AND
	aHPivHighs[0] > aHPivHighs[1] AND
	aLPivLows[0] > aLPivLows[1]) {

	tcz500 =
	(aHPivHighs[0] -
	(.5 * (aHPivHighs[0] - aLPivLows[1])));

	tcz618 =
	(aHPivHighs[0] -
	(.618 * (aHPivHighs[0] - aLPivLows[1])));

	tcz786 =
	(aHPivHighs[0] -
	(.786 * (aHPivHighs[0] - aLPivLows[0])));

	retrcRng = curBar  - aHPivIdxs[0];
	aRetrcPrc = LLV(L, retrcRng);
	aRetrcPrcBars  = LLVBars(L, retrcRng);

	retrcPrc = aRetrcPrc[curBar];
	retrcBarIdx = curBar - aRetrcPrcBars[curBar];
	retrcClose = aRetrcClose[retrcBarIdx];

	// -- bTCZLong setup?
	bTCZLong = (

		// -- Are retracement levels arranged in
		//    tcz order?

		// .500 is above .786 for long setups
		tcz500 >= (tcz786 * (1 - .005))
		AND
		// .681 is below .786 for long setups
		tcz618 <= (tcz786 * (1 + .005))
		AND

		// -- Is the low in the tcz range
		// -- Is the close >= low of tcz range
		//    and low <= high of tcz range
		retrcClose >= ((1 - .01) *  tcz618)
		AND
		retrcPrc <= ((1 + .01) *  tcz500)
		);

		// -- risk would be high of signal bar minus low of zone
		//risk = 0;

// -- lower highs and lower lows
} else if (nHPivs >= 2 AND nLPivs >=2
	AND aHPivHighs[0] < aHPivHighs[1]
	AND aLPivLows[0] < aLPivLows[1]) {

	tcz500 =
	(aHPivHighs[1] -
	(.5 * (aHPivHighs[1] - aLPivLows[0])));

	tcz618 =
	(aHPivHighs[0] -
	(.618 * (aHPivHighs[1] - aLPivLows[0])));

	tcz786 =
	(aHPivHighs[0] -
	(.786 * (aHPivHighs[0] - aLPivLows[0])));

	retrcRng = curBar  - aLPivIdxs[0];
	aRetrcPrc = HHV(H, retrcRng);
	retrcPrc = aRetrcPrc[curBar];
	aRetrcPrcBars  = HHVBars(H, retrcRng);
	retrcBarIdx = curBar - aRetrcPrcBars[curBar];
	retrcClose = aRetrcClose[retrcBarIdx];

	bTCZShort = (
		// -- Are retracement levels arranged in
		//    tcz order?

		// .500 is below .786 for short setups
		tcz500 <= (tcz786 * (1 + .005))
		AND
		// .681 is above .786 for short setups
		tcz618 >= (tcz786 * (1 - .005))
		AND

		// -- Is the close <= high of tcz range
		//    and high >= low of tcz range
		retrcClose <= ((1 + .01) *  tcz618)
		AND
		retrcPrc >= ((1 - .01) *  tcz500)
		);

		// -- Risk would be top of zone - low of signal bar
		//risk = 0;
}

// -- Show zone if present
if (bTCZShort OR bTCZLong) {

	// -- Be prepared to see symmetry
	if (bTCZShort) {
		if (aLPivIdxs[0] > aHPivIdxs[0]) {
			// -- Valuable, useful symmetry information
			nRtrc0Pts = aHPivHighs[0] - aLPivLows[1];
			nRtrc0Bars = aHPivIdxs[0] - aLPivIdxs[1] + 1;
			nRtrc1Pts = retrcPrc - aLPivLows[0];
			nRtrc1Bars = retrcBarIdx - aLPivIdxs[0] + 1;
		} else {
			nRtrc0Pts = aHPivHighs[1] - aLPivLows[1];
			nRtrc0Bars = aHPivIdxs[1] - aLPivIdxs[1] + 1;
			nRtrc1Pts = aHPivHighs[0] - aLPivLows[0];
			nRtrc1Bars = aHPivIdxs[0] - aLPivIdxs[0] + 1;
		}
	} else { // bLongSetup
		if (aLPivIdxs[0] > aHPivIdxs[0]) {
			nRtrc0Pts = aHPivHighs[0] - aLPivLows[1];
			nRtrc0Bars = aHPivIdxs[0] - aLPivIdxs[1] + 1;
			nRtrc1Pts = retrcPrc - aLPivLows[0];
			nRtrc1Bars = retrcBarIdx - aLPivIdxs[0] + 1;
		} else {
			nRtrc0Pts = aHPivHighs[1] - aLPivLows[0];
			nRtrc0Bars = aLPivIdxs[0] - aHPivIdxs[1] + 1;
			nRtrc1Pts = aHPivHighs[0] - aLPivLows[0];
			nRtrc1Bars = aLPivIdxs[0] - aHPivIdxs[0] + 1;
		}
	}

	if (bShowTCZ) {
		Plot(
			LineArray(	IIf(bTCZLong, aHPivIdxs[0], aLPivIdxs[0]),
			tcz500, curBar, tcz500 , 0),
			"tcz500", colorPaleBlue, styleLine);
		Plot(
			LineArray(	IIf(bTCZLong, aHPivIdxs[0], aLPivIdxs[0]),
			tcz618, curBar, tcz618, 0),
			"tcz618", colorPaleBlue, styleLine);
		Plot(
			LineArray(	IIf(bTCZLong, aHPivIdxs[0], aLPivIdxs[0]),
			tcz786, curBar, tcz786, 0),
			"tcz786", colorTurquoise, styleLine);
	}

// -- if (bShowTCZ)
}


// **************************
// END INDICATOR CODE
// **************************
_SECTION_END();

_SECTION_BEGIN("explorer");
fastmalenght=15;
slowmalength=30;
fastma=MA( C, fastmalenght );
slowma=MA( C, slowmalength );
eBuy=Cross( fastma , slowma );
xbuy=ADX()>10;
eSell=Cross( slowma , fastma );
Buy=eBuy AND xbuy;

/* exrem is one method to remove surplus strade signals. It removes excessive signals of arrow */
Buy = ExRem(Buy, Sell);
Sell = ExRem(Sell, Buy);
ApplyStop(stopTypeLoss,stopModePercent,Optimize( "maX. loss stop level", 12, 2, 30, 1 ),True );
_SECTION_END();

_SECTION_BEGIN("Bollinger Bands");
P = ParamField("Price field",-1);
Periods = Param("Periods", 15, 2, 100, 1 );
Width = Param("Width", 2, 0, 10, 0.05 );
Color = ParamColor("Color", colorCycle );
Style = ParamStyle("Style");
//Plot( BBandTop( P, Periods, Width ), "BBup", colorCustom12, Style );
//Plot( BBandBot( P, Periods, Width ), "BBdown", colorCustom12, Style );
bb1col=IIf(BBandTop(C,15,2)>Ref(BBandTop(C,15,2),-1),colorLime,colorRed);
bb2col=IIf(BBandBot(C,15,2)>Ref(BBandBot(C,15,2),-1),colorLime,colorRed);
Plot( BBandTop( C, 15,2 ), "" , bb1col, styleThick );
Plot( BBandBot( C, 15,2 ), "" , bb2col, styleThick );
_SECTION_END();

_SECTION_BEGIN("Visible Max and Min");
//Plot( C, "Close", ParamColor("Color", colorBlack ), styleNoTitle |
//ParamStyle("Style") | GetPriceStyle() );

function VisibleMaxValue(Value)
{
 BI	= BarIndex();
 FirstVisibleBarIndex = Status("FirstvisiblebarIndex");
 FirstVisibleBar = FirstVisibleBarIndex == BI;
 HighestVisibleValue_ = HighestSince(FirstVisibleBar, Value);
 LastVisibleBarIndex = Status("LastvisiblebarIndex");
 BlankBars	= SelectedValue(LastVisibleBarIndex - BI);
 LastVisibleBar = LastVisibleBarIndex == BI + BlankBars;
 MaxValue 	= LastValue(ValueWhen(Lastvisiblebar, HighestVisibleValue_));
 return MaxValue;
}

function VisibleMinValue(Value)
{
 BI	= BarIndex();
 FirstVisibleBarIndex = Status("FirstvisiblebarIndex");
 FirstVisibleBar = FirstVisibleBarIndex == BI;
 LowestVisibleValue_	= LowestSince(FirstVisibleBar, Value);
 LastVisibleBarIndex	= Status("LastvisiblebarIndex");
 BlankBars	= SelectedValue(LastVisibleBarIndex - BI);
 LastVisibleBar = LastVisibleBarIndex == BI + BlankBars;
 MinValue 	= LastValue(ValueWhen(Lastvisiblebar, LowestVisibleValue_));
 return MinValue;
}

Plot(VisibleMaxValue(High), "", colorTeal, 0);
Plot(VisibleMinValue(Low), "", colorTeal, 0);
_SECTION_END();

_SECTION_BEGIN("TrendChart");
//Coding by rmike Version 2.0 Based upon the work of Andrew cardwell
//Intellectual Copyright (for amibroker coding only) - rmike
//Works quite nicely with setting of 13 & higher on a weekly chart. For dail
// Intraday charts you will need to experiment with faster settings, the default of 9 is provided.
//You are free to distribute this chart afl with the proviso that it is not modified or edited
//in any way and is distributed with due acknowledgement/ reference to the original author.

pertrix = Param("period Trix", 9, 3, 13, 2 );
persig = Param("period signal", 5, 2, 200,1);

//p=Param("RSI Periods", 14, 2, 100,1);
//p=Param("RSI Periods", 9, 2, 100,1);
A=MA(C,15);
A1=MA(C,30);
//A=EMA(C,9);
//A1=WMA(C,45);
B=EMA(Trix(pertrix),9);
B1=WMA(Signal(persig),5);
TU=A>A1 AND B>B1;
TD=A<=A1 AND B<=B1;
TSU=A>A1 AND B<=B1;
TSD=A<=A1 AND B>B1;
_SECTION_END();

_SECTION_BEGIN("Super TEMA");
//Super TEMA by Cù Chulainn V1.0
n=25; Av=12; Av1=16; Av2=2; stp=2;
//n=15; Av=12; Av1=16; Av2=2; stp=2;


n = Optimize("Periods",n,2,30,1);
av = Optimize("Average",av,10,30,1);
av1 = Optimize("Average1",av1,10,30,1);
av2 = Optimize("Average2",av2,2,5,1);
stp = Optimize("Stop",stp,4,15,1);

Var1= TEMA(Close,n);
Var2= TEMA(var1,av);
Var3= (var1-var2)+var1;
Var1= TEMA(var3,av1);
Var4= MA((var1-var2)+var1,av2);
Var5=(Var1-Var2)+Var1;

Buy=Cover=Cross(Var5,Var4);
Sell=Short=Cross(Var4,VAR5);

Buy=Cover=Cross(Var5,Ref(Var5,-1));
Sell=Short=Cross(Ref(Var5,-1),VAR5);

Plot(Var5,"Super TEMA" + "("+WriteVal( n, 1.0 )+","+WriteVal(Av, 1.0 )+"," +WriteVal(Av1, 1.0 )+","+WriteVal(Av2, 1.0 )+")" ,IIf(Var5>Ref(Var5,-1),6,4));
Plot( Flip( Buy, Sell ), "Trade", colorLavender, styleArea | styleOwnScale, 0, 1 );
//Plot( Flip( Buy, Sell ), "Trade", colorPaleGreen, styleArea | styleOwnScale, 0, 1 );
_SECTION_END();
10 comments
Leave Comment
Please login here to leave a comment.
its very nice formula but theres an error we cannot edite it
What’s the problem?
i have problem:
“ln:816, col:22 error 31, syntax error, expecting ‘(’
ln:820, col:69 error 31, syntax error, expecting ‘(’
ln:829, col:68 error 31, syntax error, expecting ‘(’
ln:833, col:68 error 31, syntax error, expecting ‘(’
ln:821, col:17error 29, varible ‘maxvalue’ used without having initialized
"
thanks.
I have fixed it. Please try it again.
It’s very nice! Thanks.
Thank you, I love it.
Nice indicators out look! Thanks!!!
Nice indicator…thanks
Very Nice
Nice FORMULA.