Auto Fib-R for Amibroker (AFL)
twisterbee almost 16 years ago Amibroker (AFL)
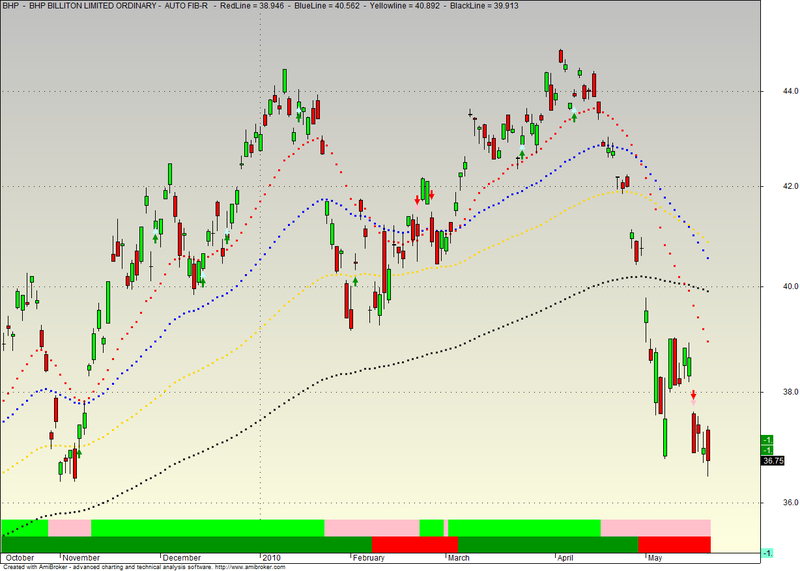
This indicator automatically plot the Fibonacci retracement levels with a single click on the price chart. Only the critical levels of 38.2%, 50% and 61.8% are shown.
Screenshots
Indicator / Formula
Copy & Paste Friendly
_SECTION_BEGIN("Background");
SetChartBkGradientFill( ParamColor("BgTop", colorLightGrey),ParamColor("BgBottom", colorLightYellow));

_SECTION_END();
_SECTION_BEGIN("Price");
SetChartOptions(0,chartShowDates|chartShowArrows|chartLogarithmic|chartWrapTitle);
_N(Title = StrFormat("{{NAME}} - {{INTERVAL}} {{DATE}} Open %g, Hi %g, Lo %g, Close %g (%.1f%%) {{VALUES}}", O, H, L, C, SelectedValue( ROC( C, 1 ) )));

Plot( C, "Close", ParamColor("Color", colorBlack ), styleNoTitle | ParamStyle("Style") | GetPriceStyle() );
if( ParamToggle("Tooltip shows", "All Values|Only Prices" ) )
{
 ToolTip=StrFormat("Open: %g\nHigh:  %g\nLow:   %g\nClose:  %g (%.1f%%)\nVolume: "+NumToStr( V, 1 ), O, H, L, C, SelectedValue( ROC( C, 1 )));
};


//Plot( C, "", IIf(Close > Open, colorGreen, colorRed), styleCandle + styleNoLabel);
_SECTION_END();

_SECTION_BEGIN("Moving Average");

x=Param("EMA 1",20,1,200,1);
y=Param("EMA 2", 50,1,200,1);
z=Param("EMA 3",100,1,200,1);
zz=Param("EMA 4",200,1,200,1);
EMA20= EMA(C,x);
EMA50=EMA(C,y);
EMA100= EMA(C,z);
EMA200=EMA(C,zz);

Plot (EMA (C,x), "EMA 20", ParamColor("EMA20",colorRed), styleDots+styleThick+styleNoLine+styleNoLabel,maskAll);
Plot (EMA (C,y), "EMA 50", ParamColor("EMA50",colorBlue), styleDots+styleThick+styleNoLine+styleNoLabel,maskAll);
Plot (EMA (C,z), "EMA 100", ParamColor("EMA100",colorGold), styleDots+styleThick+styleNoLine+styleNoLabel,maskAll);
Plot (EMA (C,zz), "EMA 200", ParamColor("EMA200",colorDarkGrey), styleDots+styleThick+styleNoLine+styleNoLabel,maskAll);

SUT=EMA(C,5)>EMA20;
SDT=EMA20>EMA(C,5);
mut= EMA20>EMA50;
mdt=EMA20<EMA50;
_SECTION_END();
_SECTION_BEGIN("Mid Term Price Trend");


MPT = IIf( mut, colorGreen, IIf( mdt, colorRed, colorYellow));
Plot( 3, "", MPT, styleArea|styleOwnScale|styleNoLabel, 0, 100);

_SECTION_END();

_SECTION_BEGIN("Short Term Price Trend");

SPT = IIf( EMA(C,5)>EMA20, colorBrightGreen, IIf( EMA20>EMA(C,5), colorPink, colorYellow));
Plot( 6, "", SPT, styleArea|styleOwnScale|styleNoLabel, 0, 100);

_SECTION_END();


//StochRSI Signal
R= 14;
S = 14;

Value1 = RSI( R );
SR=100*(Value1-LLV(Value1,S))/(HHV(Value1,S)-LLV(Value1,S));
SR1=Ref(SR,-1);

sup=(SR1<20 AND SR>=20 AND sr<80) AND SUT;
sdown=(SR1>80 AND SR<=80 AND sr>20) AND SDT;
mup=(SR1<20 AND SR>=20 AND sr<80) AND mut;
mdown=(SR1>80 AND SR<=80 AND sr>20) AND mdt;

PlotShapes(
		IIf(sup==1, shapeUpArrow, shapeNone),
			colorSkyblue, 0, 	High, Offset=-35);


PlotShapes(
		IIf(sdown==1, shapeDownArrow, shapeNone),
			colorPink, 0, 	High, Offset=-15);

PlotShapes(
		IIf(mup==1, shapeUpArrow, shapeNone),
			colorGreen, 0, 	High, Offset=-45);


PlotShapes(
		IIf(mdown==1, shapeDownArrow, shapeNone),
			colorRed, 0, 	High, Offset=-25);


_SECTION_BEGIN("Fib-R");


// Get values for fib-R

StartBar=SelectedValue(BarIndex());
FinishBar = EndValue( BarIndex() );
i = startbar;
period = FinishBar - StartBar;

Lo =LLV(L,period);
Hi = HHV(H,period);
Line0 = 0;
Line1 = 0;
Line2 = 0;
Line3 = 0;
Line4= 0;
Line5=0;
Line100 = 0;

for( i = startbar; i < finishbar; i++ )
{
if(EndValue(C)<SelectedValue(C))
{
Line0  = EndValue(Lo);
Line100 = EndValue(Hi);
Line1 = Line0 + abs(Line100-Line0)*0.236;
Line2 = Line0 + abs(Line100-Line0)*0.382;
Line3 = Line0 + abs(Line100-Line0)*0.5;
Line4 = Line0 + abs(Line100-Line0)*0.618;
Line5 = Line0 + abs(Line100-Line0)*0.768;
}
else
{
Line100  = EndValue(Lo);
Line0 = EndValue(Hi);
Line1 =Line0 - abs(Line100-Line0)*0.236;
Line2 = Line0 - abs(Line100-Line0)*0.382;
Line3 = Line0 - abs(Line100-Line0)*0.5;
Line4 = Line0 - abs(Line100-Line0)*0.618;
Line5 = Line0 - abs(Line100-Line0)*0.768;
}
}

// external fib lines begining fom selecetdbarindex()
fib0= LineArray(startbar, Line0, finishbar, Line0, 0, 1);
fib100 = LineArray(startbar, Line100, finishbar, Line100, 0, 1);

// depth of middle lines
n= round((finishbar-startbar)/2);

// middle lines
fib1= LineArray((finishbar-n), Line1, finishbar, Line1, 0, 1);
fib2= LineArray((finishbar-n), Line2, finishbar, Line2, 0, 1);
fib3= LineArray((finishbar-n), Line3, finishbar, Line3, 0, 1);
fib4= LineArray((finishbar-n), Line4, finishbar, Line4, 0, 1);
fib5= LineArray((finishbar-n), Line5, finishbar, Line5, 0, 1);

Plot(fib0,"", colorBlack, styleNoLabel);
Plot(fib100,"", colorBlack, styleNoLabel);
//Plot(fib1,"23.6%", colorYellow+styleNoLine+styleDots);
Plot(fib2,"38.2%", ParamColor("38.2% Color",colorGreen),ParamStyle("38.2% Style",styleLine+styleThick, maskAll ));
Plot(fib3,"50%", ParamColor("50% Color",colorGreen),ParamStyle("50% Style",styleLine+styleThick, maskAll ));
Plot(fib4,"61.8%", ParamColor("61.8% Color",colorAqua),ParamStyle("61.8% Style",styleThick+styleNoLine+styleDots, maskAll ));

//Plot(fib5,"76.8%", colorGold,styleLine);

Title = Name() + "  -  " +FullName()+" -  AUTO FIB-R " + "  -  RedLine = " + WriteVal(EMA20,0.3)+ "  -  BlueLine = " + WriteVal(EMA50,0.3)+ "  -  Yellowline = " + WriteVal(EMA100,0.3)+ "  -  BlackLine = " + WriteVal(EMA200,0.3);
_SECTION_END();
0 comments
Leave Comment
Please login here to leave a comment.