Pivots levles for Candles for Amibroker (AFL)
akshah almost 16 years ago Amibroker (AFL)
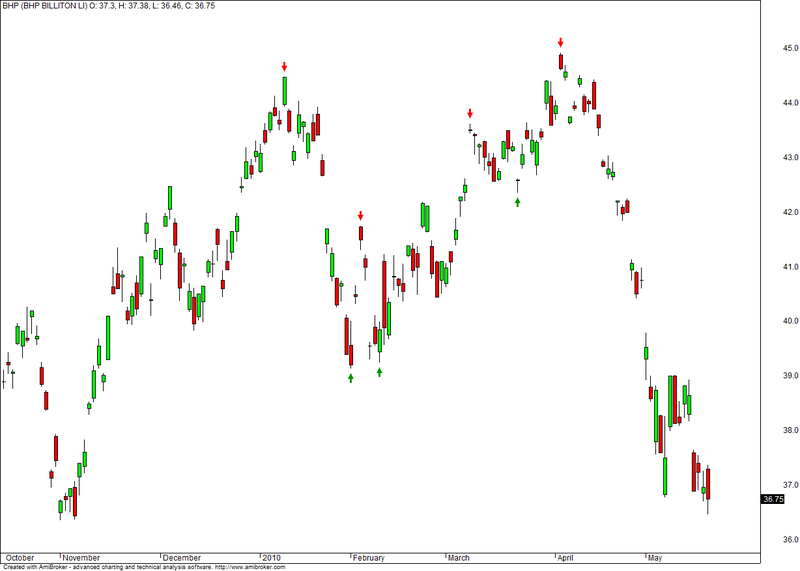
This indicator gives the pivot levels based on the candles high and low. This is not to be mistaken with the intra-day pivots but these are pivot high and low as per recent swing which can act as resistance or support. Can be used in any time frame.
Credit goes to Kumaresan Selvaraj for creating this AFL
Screenshots
Indicator / Formula
Copy & Paste Friendly
_SECTION_BEGIN("ShenbaKumar  pivots");
/* **********************************
Code to automatically identify pivots
By Kumaresan Selvaraj
 ********************************** */
// -- what will be our lookback range for the hh and ll?
farback = Param("How Far back to go", 100, 50, 5000, 10);
nBars = Param("Number of bars", 12, 5, 40);
// -- Title.

Title = Name() + " (" + StrLeft(FullName(), 15) + ") O: " + Open + ", H: "
+ High + ", L: " + Low + ", C: " + Close;
// -- Plot basic candle chart
PlotOHLC(Open, High, Low, Close,
"BIdx = " + BarIndex() +
"\n" + "O = " + O + "\n" + "H = " + H + "\n" + "L = " + L
 + "\n" + "C ", colorBlack, styleCandle);

GraphXSpace = 7;
// -- Create 0-initialized arrays the size of barcount
aHPivs = H - H;
aLPivs = L - L;
// -- More for future use, not necessary for basic plotting
aHPivHighs = H - H;
aLPivLows = L - L;
aHPivIdxs = H - H;
aLPivIdxs = L - L;
nHPivs = 0;
nLPivs = 0;
lastHPIdx = 0;
lastLPIdx = 0;
lastHPH = 0;
lastLPL = 0;
curPivBarIdx = 0;
// -- looking back from the current bar, how many bars
// back were the hhv and llv values of the previous
// n bars, etc.?
aHHVBars = HHVBars(H, nBars);
aLLVBars = LLVBars(L, nBars);
aHHV = HHV(H, nBars);
aLLV = LLV(L, nBars);
// -- Would like to set this up so pivots are calculated back from
// last visible bar to make it easy to "go back" and see the pivots
// this code would find. However, the first instance of
// _Trace output will show a value of 0
aVisBars = Status("barvisible");
nLastVisBar = LastValue(Highest(IIf(aVisBars, BarIndex(), 0)));
_TRACE("Last visible bar: " + nLastVisBar);
// -- Initialize value of curTrend
curBar = (BarCount - 1);
curTrend = "";

if (aLLVBars[curBar] < aHHVBars[curBar])
{
  curTrend = "D";
}
else
{
  curTrend = "U";
}
// -- Loop through bars. Search for
// entirely array-based approach
// in future version
for (i = 0; i < farback; i++)
{
  curBar = (BarCount - 1) - i;
  // -- Have we identified a pivot? If trend is down...
  if (aLLVBars[curBar] < aHHVBars[curBar])
  {
    // ... and had been up, this is a trend change
    if (curTrend == "U")
    {
      curTrend = "D";
      // -- Capture pivot information
      curPivBarIdx = curBar - aLLVBars[curBar];
      aLPivs[curPivBarIdx] = 1;
      aLPivLows[nLPivs] = L[curPivBarIdx];
      aLPivIdxs[nLPivs] = curPivBarIdx;
      nLPivs++;
    }
    // -- or current trend is up
  }
  else
  {
    if (curTrend == "D")
    {
      curTrend = "U";
      curPivBarIdx = curBar - aHHVBars[curBar];
      aHPivs[curPivBarIdx] = 1;
      aHPivHighs[nHPivs] = H[curPivBarIdx];
      aHPivIdxs[nHPivs] = curPivBarIdx;
      nHPivs++;
    }
    // -- If curTrend is up...else...
  }
  // -- loop through bars
}
// -- Basic attempt to add a pivot this logic may have missed
// -- OK, now I want to look at last two pivots. If the most
// recent low pivot is after the last high, I could
// still have a high pivot that I didn't catch
// -- Start at last bar
curBar = (BarCount - 1);
candIdx = 0;
candPrc = 0;
lastLPIdx = aLPivIdxs[0];
lastLPL = aLPivLows[0];
lastHPIdx = aHPivIdxs[0];
lastHPH = aHPivHighs[0];

if (lastLPIdx > lastHPIdx)
{
  // -- Bar and price info for candidate pivot
  candIdx = curBar - aHHVBars[curBar];
  candPrc = aHHV[curBar];
  if (
  lastHPH < candPrc AND
  candIdx > lastLPIdx AND
  candIdx < curBar)
  {
    // -- OK, we'll add this as a pivot...
    aHPivs[candIdx] = 1;
    // ...and then rearrange elements in the
    // pivot information arrays
    for (j = 0; j < nHPivs; j++)
    {
      aHPivHighs[nHPivs - j] = aHPivHighs[nHPivs -
      (j + 1)];
      aHPivIdxs[nHPivs - j] = aHPivIdxs[nHPivs - (j + 1)];
    }
    aHPivHighs[0] = candPrc;
    aHPivIdxs[0] = candIdx;
    nHPivs++;
  }
}
else
{
  // -- Bar and price info for candidate pivot
  candIdx = curBar - aLLVBars[curBar];
  candPrc = aLLV[curBar];
  if (lastLPL > candPrc AND candIdx > lastHPIdx AND candIdx < curBar)
  {
    // -- OK, we'll add this as a pivot...
    aLPivs[candIdx] = 1;
    // ...and then rearrange elements in the
    // pivot information arrays
    for (j = 0; j < nLPivs; j++)
    {
      aLPivLows[nLPivs - j] = aLPivLows[nLPivs - (j + 1)];
      aLPivIdxs[nLPivs - j] = aLPivIdxs[nLPivs - (j + 1)];
    }
    aLPivLows[0] = candPrc;
    aLPivIdxs[0] = candIdx;
    nLPivs++;
  }
}
// -- Dump inventory of high pivots for debugging
/*
for (k=0; k<nHPivs; k++) {
_TRACE("High pivot no. " + k
+ " at barindex: " + aHPivIdxs[k] + ", "
+ WriteVal(ValueWhen(BarIndex()==aHPivIdxs[k],
DateTime(), 1), formatDateTime)
+ ", " + aHPivHighs[k]);
}
 */
// -- OK, let's plot the pivots using arrows
PlotShapes(IIf(aHPivs == 1, shapeDownArrow, shapeNone), colorRed, 0, High, Offset =  - 15);
PlotShapes(IIf(aLPivs == 1, shapeUpArrow, shapeNone), colorGreen, 0, Low, Offset =  - 15);
Buy = aHPivs;
BuyPrice = High;
Short = aLPivs;
ShortPrice = Low;

Filter = C>50;
NumColumns = 4;
Column0 = FullName();
Column1 = Close;
Column2 = High;
Column3 = Low;

_SECTION_END();
3 comments
Leave Comment
Please login here to leave a comment.
Many tks for sharing.
looks like future price indicator
how to scan with this AFL?