LSS Oscillator for Amibroker (AFL)
WWW999 almost 16 years ago Amibroker (AFL)
BOOK “Sniper Trading” by George Angell
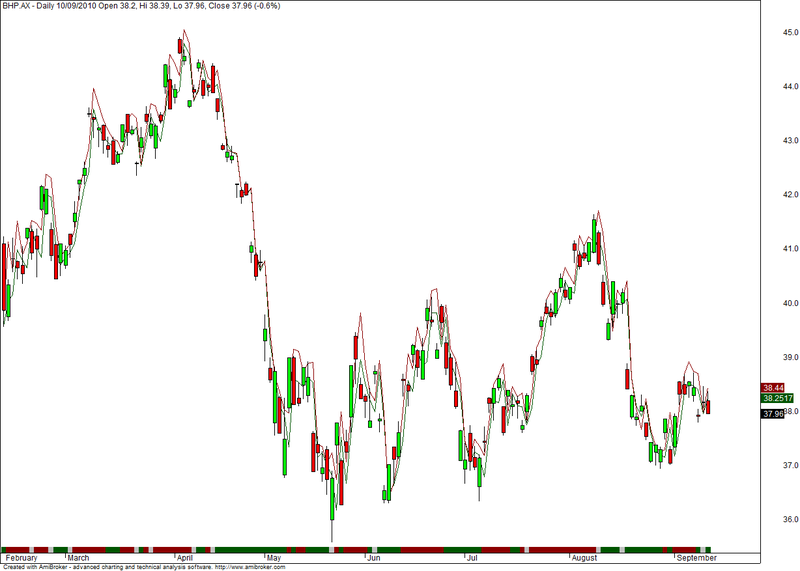
1. Hypothetical 5-Day PeriodFiv-Day C > RR for buy C < SS for Sell 2. LSS Oscillator Red area > Direction Up Grey > Direction None Green > Driect DownScreenshots
Indicator / Formula
Copy & Paste Friendly
/* BOOK "Sniper Trading" by George Angell
   1. Hypothetical 5-Day PeriodFiv-Day
            C > RR for buy
            C < SS for Sell

   2. LSS Oscillator
              Red area > Direction Up
          Grey > Direction None
              Green > Driect Down
*/
_SECTION_BEGIN("Price");
_N(Title = StrFormat("{{NAME}} - {{INTERVAL}} {{DATE}} Open %g, Hi %g, Lo %g, Close %g (%.1f%%) {{VALUES}}", O, H, L, C, SelectedValue( ROC( C, 1 ) ) ));
Plot( C, "Close", ParamColor("Color", colorBlack ), styleNoTitle | ParamStyle("Style") | GetPriceStyle() );
_SECTION_END();
nPrevC1=TimeFrameGetPrice( "C", inDaily, -1);
nPrevC4=TimeFrameGetPrice( "C", inDaily, -4);
nPrevH1=TimeFrameGetPrice( "H", inDaily, -1);
nPrevH2=TimeFrameGetPrice( "H", inDaily, -2);
nPrevH3=TimeFrameGetPrice( "H", inDaily, -3);
nPrevH4=TimeFrameGetPrice( "H", inDaily, -4);
nPrevH5=TimeFrameGetPrice( "H", inDaily, -5);
nPrevL1=TimeFrameGetPrice( "l", inDaily, -1);
nPrevL2=TimeFrameGetPrice( "l", inDaily, -2);
nPrevL3=TimeFrameGetPrice( "l", inDaily, -3);
nPrevL4=TimeFrameGetPrice( "l", inDaily, -4);
nPrevL5=TimeFrameGetPrice( "l", inDaily, -5);
nPrevO1=TimeFrameGetPrice( "O", inDaily, -1);
//Hypothetical 5-Day PeriodFiv-Day
nX= (nPrevH1 + nPrevL1 + nPrevC1)/3;

nUp = nPrevL1 + (( nPrevH1-nPrevL2)+( nPrevH2-nPrevL3)+( nPrevH3-nPrevL4))/3 ;
nBuyH = nPrevH1 + (( nPrevH1-nPrevH2)+( nPrevH2-nPrevH3)+( nPrevH3-nPrevH4))/3 ;
nLLSUp = 2 * nX - nPrevL1 ;
nRR = (nUp + nBuyH + nPrevH1  + nLLSUp) / 4 ;

nDn = nPrevH1 + (( nPrevH2-nPrevL1)+( nPrevH3-nPrevL2)+( nPrevH4-nPrevL3))/3 ;
nBuyL = nPrevL1 - (( nPrevL2-nPrevL1)+( nPrevL3-nPrevL2)+( nPrevL4-nPrevL3))/3 ;
nLLSDn = 2 * nX - nPrevH1 ;
nSS = (nDn + nBuyL + nPrevL1  + nLLSDn) / 4 ;
Plot( nRR, "RR", colorDarkRed, styleNoTitle );
Plot( nSS, "SS", colorDarkGreen, styleNoTitle );
// LSS Oscillator
nMax1D=Max(nPrevH1,nPrevH2);
nMax2D=Max(nPrevH3,nPrevH4);
nMax3D=Max(nMax1D,nMax2D);
nMaxD=Max(nMax3D,H);//nPrevH5);

nMin1D=Max(nPrevL1,nPrevL2);
nMin2D=Max(nPrevL3,nPrevL4);
nMin3D=Max(nMin1D,nMin2D);
nMinD=Max(nMin3D,L);//nPrevL5);
nXXD  = nMaxD - nPrevC4;
nYYD = C - nMinD;
nOscD =(nXXD+nYYD)/((nMaxD-nMinD)*2)*100;


Plot( 1, "", IIf(nOscD>70,colorDarkRed, IIf(nOscD<30, colorDarkGreen, colorLightGrey)), styleOwnScale|styleArea|styleNoLabel, -0.1, 100 );
0 comments
Leave Comment
Please login here to leave a comment.