Daily Close Price Histogram for Amibroker (AFL)
taifur_pavel almost 16 years ago Amibroker (AFL)
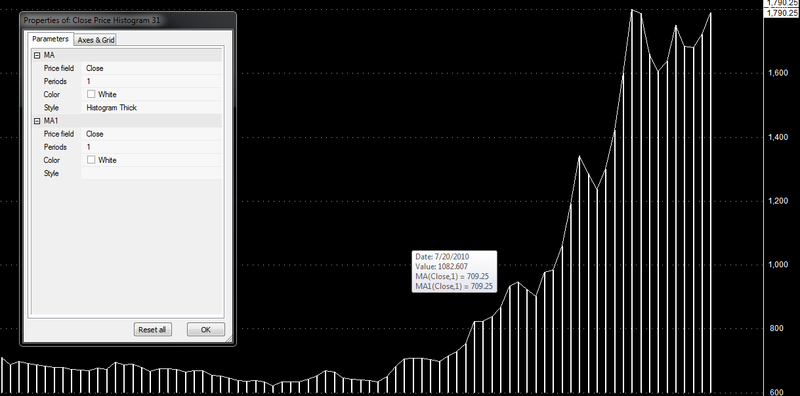
Everyday Close price graph with histogram, which helps spot the High n Low of a Swing. select the param as shown on the pic.
Screenshots
Indicator / Formula
Copy & Paste Friendly
_SECTION_BEGIN("MA");
P = ParamField("Price field",-1);
Periods = Param("Periods", 1, 1, 100, 1, 1 );
Plot( MA( P, Periods ), _DEFAULT_NAME(), ParamColor( "Color", colorCycle ), ParamStyle( "Style", styleHistogram | styleThick, maskHistogram  ) );
_SECTION_END();

_SECTION_BEGIN("MA1");
P = ParamField("Price field",-1);
Periods = Param("Periods", 1, 1, 100, 1, 1 );
Plot( MA( P, Periods ), _DEFAULT_NAME(), ParamColor( "Color", colorCycle ), ParamStyle("Style") );
_SECTION_END();
4 comments
Leave Comment
Please login here to leave a comment.
EARLIER SEEN THIS IN METATRADER. QUITE HAPPY TO SEE IT IN AMI.IT HELPS A LOT THANKS FOR SUCH A FINE TOOL. I WAS THINKING TO MAKE A SOFTWARE FOR THIS.
REALLY GRATEFUL TO YOU FOR THIS IMMENSE HELP.
THANKS FROM THE HEART
Hi,
it will be better way by below code
Plot( C, “Close”, ParamColor(“Color”, colorBlack ),ParamStyle(“Style”,styleNoTitle|styleArea,maskAll) );
Hi taifur_pavel ,
Thanks for this formula, good as it is.
Regards,
thanx guys for ur inspiring complements