Time and Money chart (HURST Band Like) for Amibroker (AFL)
Pascal SAMSON almost 16 years ago Amibroker (AFL)
I would like to tell you about a formula introduced in May 2003 TRADERS’ TIPS magazine.
In “Time And Money Charts”, Stuart Belknap presented a new charting technique, called TAM chart.
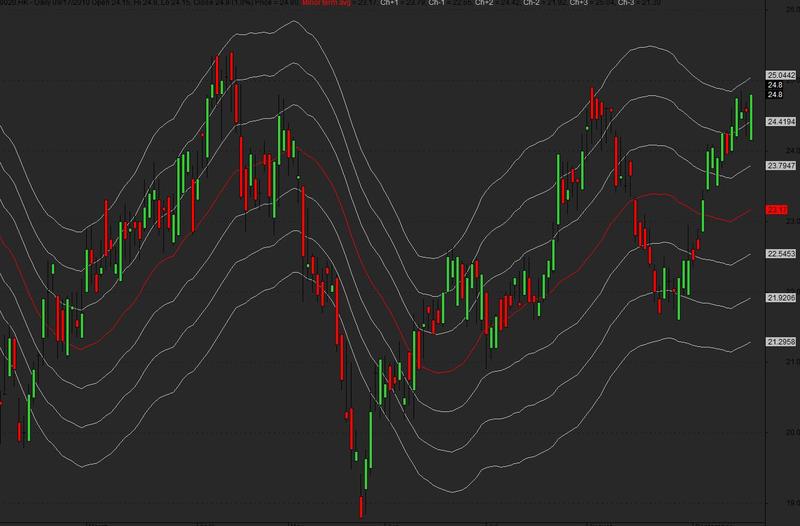
Prices tend to regress toward the mean, which is represented by the red centerline on the TAM chart (HURST Bands Like). The three bands above and below and paralleling the centerline represent one, two and three sigmas of the actual data points from the mean centerline.
Listing above shows the code that plots the TAM chart with price and real-time trendlines.
Screenshots
Indicator / Formula
Copy & Paste Friendly
_SECTION_BEGIN("Price");
SetChartOptions(0,chartShowArrows|chartShowDates);
_N(Title = StrFormat("{{NAME}} - {{INTERVAL}} {{DATE}} Open %g, Hi %g, Lo %g, Close %g (%.1f%%) {{VALUES}}", O, H, L, C, SelectedValue( ROC( C, 1 ) ) ));
Plot( C, "Close", ParamColor("Color", colorBlack ), styleNoTitle | ParamStyle("Style") | GetPriceStyle() );
_SECTION_END();

_SECTION_BEGIN("Time and Money");
// plot candlestick price chart
Plot( Close, "Price", colorBlack, styleCandle );
GraphXSpace = 1;
// define TAM chart period
period = 25;
// users of AB version 4.30 can use Param
// period = Param( "TAM period", 25, 2, 100, 1 );
halfperiod = floor( period /2 );
// minor term average
Arm = MA( Close, period );
Plot( Arm, "Minor term avg", colorRed );
// calculate volatility
yom = 100 * ( C - Ref( Arm, halfperiod ))/Ref( Arm, halfperiod );
avyom = MA( yom, 2 * period );
varyom = MA( yom * yom, 2 * period ) - avyom * avyom;
som = Ref( sqrt( varyom ), -halfperiod );
sigom = MA( som, period );
// plot reference price grid
Plot( Arm * ( 1 + 0.01 * sigom ), "Ch+1", colorLightGrey );
Plot( Arm * ( 1 - 0.01 * sigom ), "Ch-1", colorLightGrey );
Plot( Arm * ( 1 + 0.02 * sigom ), "Ch+2", colorLightGrey );
Plot( Arm * ( 1 - 0.02 * sigom ), "Ch-2", colorLightGrey );
Plot( Arm * ( 1 + 0.03 * sigom ), "Ch+3", colorLightGrey );
Plot( Arm * ( 1 - 0.03 * sigom ), "Ch-3", colorLightGrey );
_SECTION_END();
1 comments
Leave Comment
Please login here to leave a comment.
Excellent Indicator…