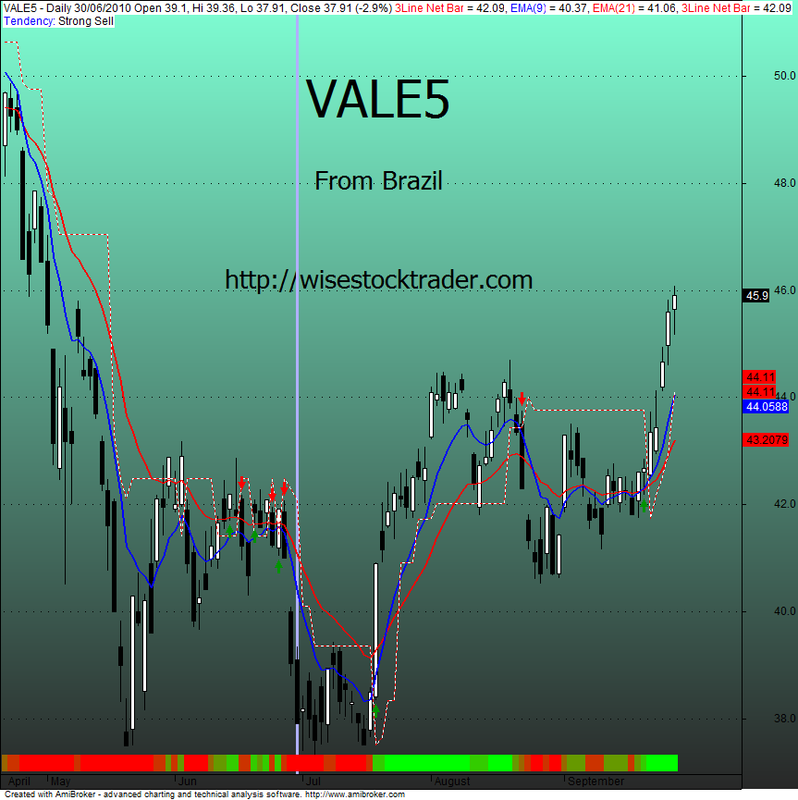
Three Line Net Bar And Tendency for Amibroker (AFL)
moapereira almost 16 years ago Amibroker (AFL)
Trading system based on five criteria for defining trend of two famous Brazilian trades: Leandro Ruschel and Alexander Wolwacz “Stormer” (*), including the Three Line Net Bar of Joseph B. Stowell.
Trading system created to exemplify the five criteria. I do not recommend its use.
Screenshots
Indicator / Formula
Copy & Paste Friendly
/////////////////////////////////////////////////////////////////////////////////
// FRACTAL - Peak and Though
/////////////////////////////////////////////////////////////////////////////////

PH1= ValueWhen(
(Ref(H,-2) > Ref(H, -4)) AND
(Ref(H,-2) > Ref(H, -3)) AND
(Ref(H,-2) > Ref(H, -1)) AND
(Ref(H,-2) > H), Ref(H,-2));

PL1= ValueWhen(
(Ref(L,-2) <= Ref(L, -4)) AND
(Ref(L,-2) <= Ref(L, -3)) AND
(Ref(L,-2) <= Ref(L, -1)) AND
(Ref(L,-2) <= L), Ref(L,-2));

PH2= ValueWhen(
(Ref(H,-2) > Ref(H, -4)) AND
(Ref(H,-2) > Ref(H, -3)) AND
(Ref(H,-2) > Ref(H, -1)) AND
(Ref(H,-2) > H), Ref(H,-2),2);

PL2= ValueWhen(
(Ref(L,-2) <= Ref(L, -4)) AND
(Ref(L,-2) <= Ref(L, -3)) AND
(Ref(L,-2) <= Ref(L, -1)) AND
(Ref(L,-2) <= L), Ref(L,-2),2);

TendLong = (PL1 > PL2 AND PH1 > PL1 AND C>PL1);
TendShrt = (PH1 < PH2 AND PL1 > PH1 AND C<PH1);


/////////////////////////////////////////////////////////////////////////////////
// THREE LINE NET BAR - Joseph Stowell
/////////////////////////////////////////////////////////////////////////////////
_SECTION_BEGIN("Three Line Net Bar");
NetBarPeriod = Param("3Line Net Bar Period",13,5,30,1);
function ThreeLineUp()
{
	H2[0] = result[0] = 0;
	for (i = 10; i < BarCount; i++)
	{
		for (j = 1; j < i; j++) if((H[i-j]>H[i]))  {H2[i]  = H[i-j]; break;}
		for (j = 1; j < i; j++)	if((H[i-j]>H2[i])) {result[i] =  H[i-j]; break;}
	}
	return result;
}

function ThreeLineDn()
{
	L2[0] = result[0] = 0;
	for (i = 10; i < BarCount; i++)
	{
		for (j = 1; j < i; j++) if((L[i-j]<L[i])) {L2[i] = L[i-j]; break;}
		for (j = 1; j < i; j++) if((L[i-j]<L2[i])) {result[i] = L[i-j]; break;}
    }
	 return result;
}

LineDn = ValueWhen(H==HHV(H,NetBarPeriod),ThreeLineDn(),1);
LineUp = ValueWhen(L==LLV(L,NetBarPeriod),ThreeLineUp(),1);
Hlv = IIf(C>LineDn,1,IIf(C<LineUp,-1,0));
Hlv = ValueWhen(Hlv!=0,Hlv,1);
ThreeLineNetBar = IIf(Hlv==1,LineDn,LineUp);

_SECTION_END();

/////////////////////////////////////////////////////////////////////////////////
// MOVING AVERAGE
/////////////////////////////////////////////////////////////////////////////////
TendencyCritery = ParamList("Tendency System","Stormer|Leandro");

if (TendencyCritery == "Stormer" )
{
	Plot(EMA(C,9),"EMA(9)",colorBlue,styleThick);
   	Plot(EMA(C,21),"EMA(21)",colorRed,styleThick);
	Plot(ThreeLineNetBar, "3Line Net Bar", ParamColor("Color",colorRed),ParamStyle("Style",styleDashed));
}
if (TendencyCritery == "Leandro" )
{
	Plot(MA(C,21),"MA(21)",colorBlue,styleThick);
	Plot(MA(C,50),"MA(50)",colorRed,styleThick);
	Plot(MA(C,200),"MA(200)",colorOrange,styleThick);
}
/////////////////////////////////////////////////////////////////////////////////
// RIBBON - Tendency Indicator
/////////////////////////////////////////////////////////////////////////////////
_SECTION_BEGIN("trending ribbon");

global points;

function bgColorPerc(P)
{
  return ColorRGB(255-(P/100)*255,(P/100)*255,0);
}

if (TendencyCritery == "Stormer")
   Points = IIf(C>EMA(C,9),1,0)+(EMA(C,9)>EMA(C,21))+(EMA(C,21)>Ref(EMA(C,21),-1))+TendLong+IIf(C>ThreeLineNetBar,1,0);
else
   Points = IIf(C>MA(C,21),1,0)+(MA(C,21)>MA(C,50))+(MA(C,50)>MA(C,200))+(MA(C,21)>Ref(MA(C,21),-1))+TendLong;

ColorNumber = (Points/5)*100;
Plot( 2, "", bgColorPerc(ColorNumber), styleOwnScale|styleArea|styleNoLabel, -0.5, 100 );
_SECTION_END();

_SECTION_BEGIN("Title");

SetChartOptions(0,chartShowDates|chartShowArrows|chartLogarithmic|chartWrapTitle);
_N(Title = StrFormat("{{NAME}} - {{INTERVAL}} {{DATE}} Open %g, Hi %g, Lo %g, Close %g (%.1f%%) {{VALUES}}", O, H, L, C, SelectedValue( ROC( C, 1 ) ))+"\n"+
EncodeColor(colorBlue)+"Tendency: "+EncodeColor(colorBlack)+WriteIf(Points==5,"Strong Buy",WriteIf(Points==4,"Buy",WriteIf(Points==3,"Hold",WriteIf(points==0,"Strong Sell","Sell")))));

Plot(C,"",ParamColor("color",colorBlack),styleCandle);
_SECTION_END();

///////////////////////////////////////////////////////////////////////
// GRAFICO - Background Text
///////////////////////////////////////////////////////////////////////
_SECTION_BEGIN("Background text");
SetChartOptions(0,chartShowArrows|chartShowDates);
C11=ParamColor("up panel",colorAqua );
C12=ParamColor("dn panel",colorDarkGrey );
C13=Param("fonts",20,10,30,1 );
C14=Param("left-right",2.1,1.0,5.0,0.1 );
C15=Param("up-down",12,1,20,1 );
Miny = Status("axisminy");
Maxy = Status("axismaxy");
lvb = Status("lastvisiblebar");
fvb = Status("firstvisiblebar");
pxwidth = Status("pxwidth");
pxheight = Status("pxheight");
GfxSetBkMode( 0 );
GfxSetOverlayMode(1);
GfxGradientRect(0,0,pxwidth, pxheight, C11, C12 );
GfxSelectFont("Tahoma", Status("pxheight")/C13 );
GfxSetTextAlign( 6 );
GfxTextOut( Name(), Status("pxwidth")/C14, Status("pxheight")/C15 );
GfxSelectFont("Tahoma", Status("pxheight")/C13*0.5 );
GfxTextOut( "From Brazil", Status("pxwidth")/C14, Status("pxheight")/C15*2.5 );
GfxSelectFont("Tahoma", Status("pxheight")/C13*0.5 );
GfxTextOut( "htt://wisestocktrader.com", Status("pxwidth")/C14, Status("pxheight")/C15*4 );
_SECTION_END();

//////////////////////////////////////////////////////////////////////////
// TRADING SYSTEM
/////////////////////////////////////////////////////////////////////////

Buy = (Points > 3);
Sell = (Points < 3);
Buy = ExRem(Buy,Sell);
Sell = ExRem(Sell,Buy);

PlotShapes( Buy* shapeUpArrow, IIf( Buy, colorGreen, colorRed ), 0, IIf( Buy,Low, High) );
PlotShapes( Sell* shapeDownArrow, IIf( Buy, colorGreen, colorRed ), 0, IIf( Buy,Low, High) );

///////////////////////////////////////////////////////////////////////////
// EXPLORER
///////////////////////////////////////////////////////////////////////////

AddColumn(Close,"Close",1.2);
AddColumn((V/MA(V,20))*100,"Vol (%)",1.2);
AddColumn(Points,"Force Tendency",1.0, colorDefault, bgColorPerc((Points/5)*100));
Filter = MA(V,20)>(C*5000);
0 comments
Leave Comment
Please login here to leave a comment.