COMBO TRADE AFL for Amibroker (AFL)
SREENAN almost 16 years ago Amibroker (AFL)
Credit goes to Sikandar for this wonderful combination of AFL…please test thoroughly though due to zig function….works on 15 minutes..comments please
Screenshots
Indicator / Formula
Copy & Paste Friendly
PositionSize = MarginDeposit = 1;
Z=Optimize("Z",Param("Zig",2,.1,10,0.1),.1,10,.1);
p=Param("Volume EMA",15,0,100,1);
Buy = Cover = C>Ref(C,-1) AND Ref(C,-1)>Ref(C,-2) AND V>EMA(V,p) AND Zig(C,Z)>Ref(Zig(C,Z),-1) ;
Sell = Short = C<Ref(C,-1) AND Ref(C,-1)<Ref(C,-2) AND V>EMA(V,p) AND Zig(C,Z)<Ref(Zig(C,Z),-1) ;
Filter = Buy OR Sell OR Short OR Cover;
Buy = ExRem(Buy,Sell);
Sell = ExRem(Sell,Buy);
Short = ExRem(Short,Cover);
Cover = ExRem(Cover,Short);
AddColumn( Ref(C,-2), "DAY BEFORE YESTERDAY " );
AddColumn( Ref(C,-1), "YESTERDAY " );
AddColumn( Close, "Close" );
AddColumn( V, "Volume" );
AddColumn( EMA(V,p), " EMA Volume "+P );
AddColumn( Zig(C,Z), "ZIG-ZAG" +Z );
PlotOHLC(O,H,L,C,"Price",IIf(C>O,colorGreen,colorRed),styleBar|styleThick);
PlotShapes(IIf(Buy, shapeSquare, shapeNone),colorGreen, 0, L, Offset=-40);
PlotShapes(IIf(Buy, shapeSquare, shapeNone),colorLime, 0,L, Offset=-50);
PlotShapes(IIf(Buy, shapeUpArrow, shapeNone),colorWhite, 0,L, Offset=-45);
PlotShapes(IIf(Sell, shapeSquare, shapeNone),colorRed, 0, H, Offset=40);
PlotShapes(IIf(Sell, shapeSquare, shapeNone),colorOrange, 0,H, Offset=50);
PlotShapes(IIf(Sell, shapeDownArrow, shapeNone),colorWhite, 0,H, Offset=-45);
/*http://www.traders.com/documentation...ackissues.html
go to 2009 Articles > June 2009 > Traders Tips
LISTING 1*/
Version(5.20); // requires v5.20
SetBarsRequired(sbrAll);
// get start date
Start = Cross( DateNum(), ParamDate("Start date", "2005-10-30" ) );
Started = Flip( Start, 0 );
StopMode = ParamList("Stop Mode", "Fixed|Chandelier|Modified ATR" );
StopLevel = Param("Fixed perc %", 14, 0.1, 50, 0.1)/100;
StopATRFactor = Param("ATR multiple", 4, 0.5, 10, 0.1 );
StopATRPeriod = Param("ATR period", 14, 3, 50 );
// calculate support and resistance levels
if( StopMode == "Fixed" ) // fixed percent trailing stop
{
sup = C * ( 1 - stoplevel );
res = C * ( 1 + stoplevel );
}
else // Chandelier ATR-based stop
if( StopMode == "Chandelier" )
{
sup = C - StopATRFactor * ATR( StopATRPeriod );
res = C + StopATRFactor * ATR( StopATRPeriod );
}
else
{
HL = H - L;
MAHL = 1.5 * MA( HL, StopATRPeriod );
HiLo = IIf( HL < MAHL, HL, MAHL );
H1 = Ref( H, -1 );
L1 = Ref( L, -1 );
C1 = Ref( C, -1 );
Href = IIf( L <= H1, H - C1, ( H - C1 ) - ( L - H1 ) / 2 );
Lref = IIf( H >= L1, C1 - L, ( C1 - L ) - ( L1 - H ) / 2 );
diff1 = Max( HiLo, HRef );
diff2 = Max( diff1, LRef );
ATRmod = Wilders( diff2, StopATRPeriod );
sup = C - StopATRFactor * ATRmod ;
res = C + StopATRFactor * ATRmod ;
}
// calculate trailing stop line
trailARRAY = Null;
trailstop = 0;
for( i = 1; i < BarCount; i++ )
{
if( Started[ i ] == 0 ) continue;
if( C[ i ] > trailstop AND C[ i - 1 ] > trailstop )
trailstop = Max( trailstop, sup[ i ] );
else
if( C[ i ] < trailstop AND C[ i - 1 ] < trailstop )
trailstop = Min( trailstop, res[ i ] );
else
trailstop = IIf( C[ i ] > trailstop, sup[ i ], res[ i ] );
trailARRAY[ i ] = trailstop;
}
// generate buy/sell signals based on crossover with trail stop line
//Buy = Start OR Cross( C, trailArray );
//Sell = Cross( trailArray, C );
//PlotShapes(Buy*shapeUpArrow,colorGreen,0,trailarray);
//PlotShapes(Sell*shapeDownArrow,colorRed,0,trailarray);
//Plot( Close,"Price",colorBlack,styleBar);
//SetBarFillColor( colorYellow );
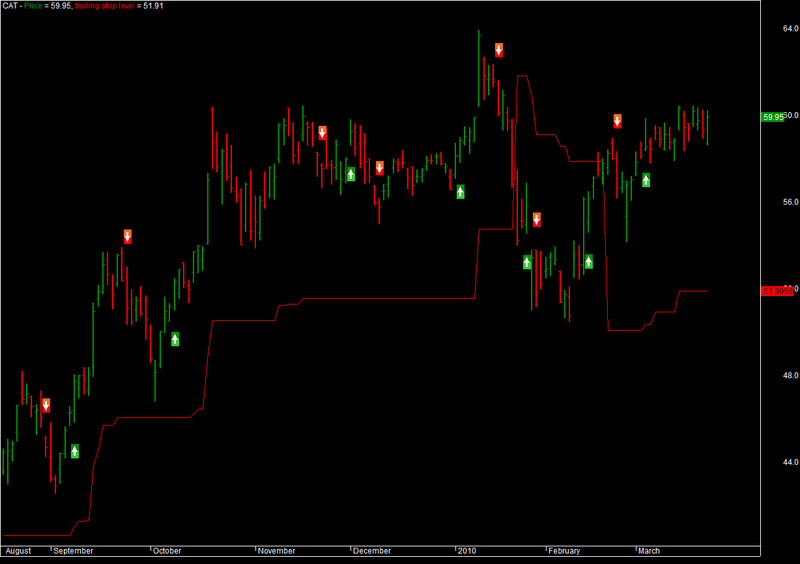
Plot( trailARRAY,"trailing stop level", ParamColor( "Color", colorCycle ), ParamStyle("Style")); 4 comments
Leave Comment
Please login here to leave a comment.
plz tell me what changes for ami 5.00 version
my version is 5.20 but is showing nothing only price bars
This AFL is not wonderful as claimed by the contributor.This AFL is bogus and useless since it looks into future prices.
no buy sell pls tell how to put