Apple Indicator for Amibroker (AFL)
ranjitc_76 almost 16 years ago Amibroker (AFL)
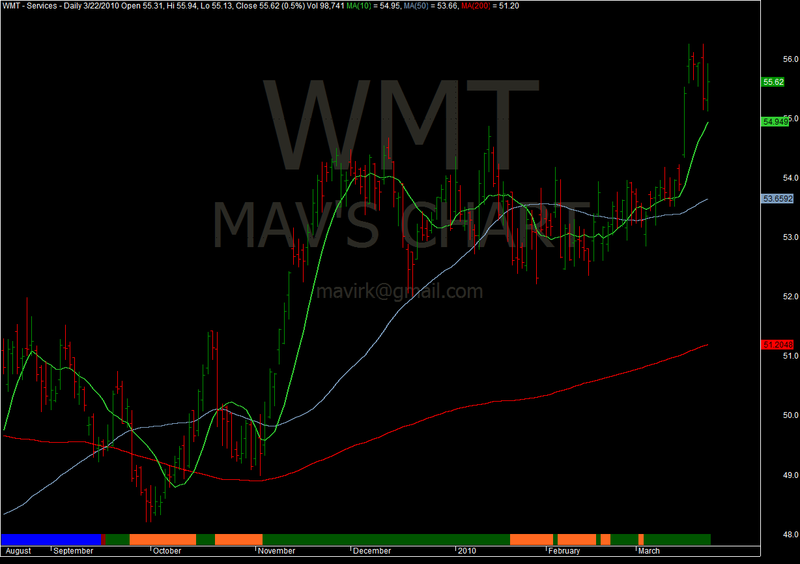
Apple indicator and system based on three common moving averages. Includes highlighting.
Screenshots
Indicator / Formula
Copy & Paste Friendly
_SECTION_BEGIN("Price");
COLOR = IIf(C > O, colorGreen, colorRed);
SetChartOptions( 0, chartShowDates | chartShowArrows | chartLogarithmic | chartWrapTitle );
_N( Title = StrFormat( "{{NAME}} - " + SectorID( 1 ) + " - {{INTERVAL}} {{DATE}} Open %g, Hi %g, Lo %g, Close %g (%.1f%%) Vol " + WriteVal( V, 1.0 ) + " {{VALUES}}", O, H, L, C, SelectedValue( ROC( C, 1 ) ) ) );
Plot( C, "Close", color, styleBar | styleNoTitle | ParamStyle( "Style" ) | GetPriceStyle() );

if ( ParamToggle( "Tooltip shows", "All Values|Only Prices" ) )
{
    ToolTip = StrFormat( "Open: %g\nHigh:  %g\nLow:   %g\nClose:  %g (%.1f%%)\nVolume: " + NumToStr( V, 1 ), O, H, L, C, SelectedValue( ROC( C, 1 ) ) );
}
Plot(MA(C,10), "MA(10)", colorLime, styleThick);
Plot(MA(C,50), "MA(50)", colorLightBlue, styleThick);
Plot(MA(C,200), "MA(200)", colorRed, styleThick);
_SECTION_END();

_SECTION_BEGIN("Phase");
RCP = C > MA(C,50) AND MA(C,50) < MA(C,200); // Recovery
ACP = C > MA(C,50) AND C > MA(C,200) AND MA(C,50) < MA(C,200); // Accumulation
BLP = C > MA(C,50) AND C > MA(C,200) AND MA(C,50) > MA(C,200); // Bullish
WRP = C < MA(C,50) AND MA(C,50) > MA(C,200); // Warning
DSP = C < MA(C,50) AND C < MA(C,200) AND MA(C,50) > MA(C,200); // Distribution
BRP = C < MA(C,50) AND C < MA(C,200) AND MA(C,50) < MA(C,200); // Bearish

Plot( 1, "", IIf(RCP, colorBlue, IIf(ACP, colorSeaGreen, IIf(BLP, colorDarkGreen, IIf(WRP, colorOrange, IIf(DSP, colorRed, IIf(BRP, colorDarkRed, 0)))))), styleOwnScale|styleArea|styleNoLabel, -0.1, 50 );
_SECTION_END();

GraphXSpace = 5;

_SECTION_BEGIN("Commentary");
printf ( "=========================" +"\n");
printf ( "PRICE ANALYSIS" +"\n");
printf ( "=========================" +"\n");
printf ( Name() + " - " +Interval(2) +  "  - " + Date() +" - " +"\n\n"+"Open= "+O+"\n"+"High= "+H+"\n"+"Low= "+L+"\n"+"Close= "+C+"\n"+
"Last Close= "+  WriteVal(Ref(C,-1), formate = 1.2)+ "\n"+
"Change= "+  WriteVal(C - Ref(C,-1), formate = 1.2)+ "\n\n"+
"Range= "+ WriteVal(H-L, formate = 1.2)+"\n"+"O/C Diff= "+  WriteVal(C - O, formate = 1.2)+ "\n\n"+
"Volume= "+ WriteVal(V, formate = 1.0)+"\n"+
"Avg. Vol= "+ WriteVal(MA(MA(MA(V,20),20),20), formate = 1.0)+"\n");
_SECTION_END();


//=====================================================================
//background stock name (works only on Amibroker version 5.00 onwards.
//=====================================================================
_SECTION_BEGIN("Name");
GfxSetOverlayMode(1);
GfxSelectFont("Tahoma", Status("pxheight")/6 );
GfxSetTextAlign( 6 );// center alignment
//GfxSetTextColor( ColorRGB( 200, 200, 200 ) );
GfxSetTextColor( ColorHSB( 42, 42, 42 ) );
GfxSetBkMode(0); // transparent
GfxTextOut( Name(), Status("pxwidth")/2, Status("pxheight")/12 );
GfxSelectFont("Tahoma", Status("pxheight")/12 );
GfxTextOut( "MAV'S CHART", Status("pxwidth")/2, Status("pxheight")/3 );
GfxSelectFont("Tahoma", Status("pxheight")/36 );
GfxTextOut( "mavirk@gmail.com", Status("pxwidth")/2, Status("pxheight")/2 );
_SECTION_END();
//======================================================================================
0 comments
Leave Comment
Please login here to leave a comment.