Profit Table – Amibroker for Amibroker (AFL)
ccc over 15 years ago Amibroker (AFL)
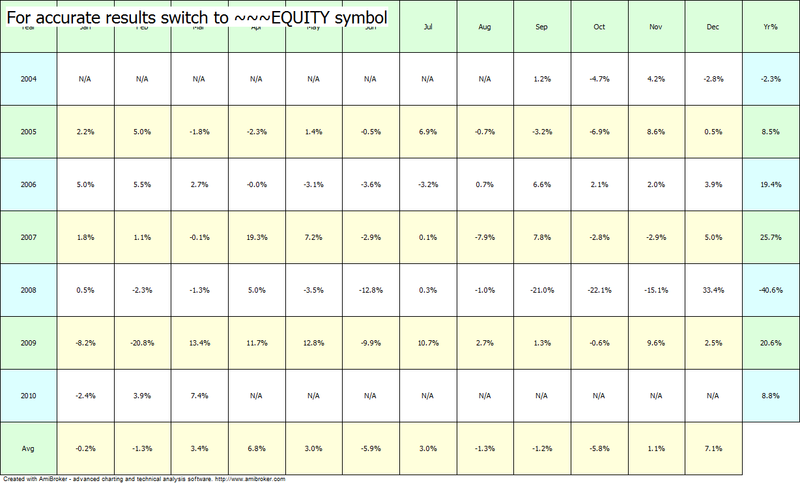
Profit Table – Amibroker
Here is an another interesting afl code which plots the Profit table for any sort of Instruments in Amibroker.
Month-on-Month , Year-on-Year, Average monthly returns in terms of percentage can be plotted using this
afl code. Sample AFL code for Nifty has been shown in the above snapshot(Click on the table to get an enlarged view)
Screenshots
Indicator / Formula
Copy & Paste Friendly
eq = C;

yr = Year();
mo = Month();

YearChange = yr != Ref( yr, -1 );
MonChange = mo != Ref( mo, -1 );

FirstYr = 0;
LastYr = 0;

startbar = 0;

////////////////////////////
// SKIP non-trading bars
////////////////////////////
for( i = 0; i < BarCount; i++ )
{
  if( eq[ i ] )
  {
    startbar = i;
    break;
  }
}

////////////////////////////
// collect yearly / monthly changes in equity
// into dynamic variables
////////////////////////////

LastYrValue = eq[ startbar  ];
LastMoValue = eq[ startbar  ];

MaxYrProfit = MinYrProfit = 0;
MaxMoProfit = MinMoProfit = 0;

for( i = startbar + 1; i < BarCount; i++ )
{
  if( YearChange[ i ] || i == BarCount - 1 )
  {
    Chg = 100 * ( -1 + eq[ i ] / LastYrValue );
    VarSet("ChgYear"+ yr[ i - 1 ], Chg );

    MaxYrProfit = Max( MaxYrProfit, Chg );
    MinYrProfit = Min( MinYrProfit, Chg );

    if( FirstYr == 0 ) FirstYr = yr[ i - 1 ];
    LastYr = yr[ i ];

    LastYrValue = eq[ i ];
  }

  if( MonChange [ i ] || i == BarCount - 1 )
  {
    mon = mo[ i - 1 ];

    Chg = 100 * ( -1 + eq[ i ] / LastMoValue );

    VarSet("ChgMon" + yr[ i - 1 ] + "-" + mon, Chg );
    VarSet("SumChgMon"+ mon, Chg + Nz( VarGet("SumChgMon"+ mon ) ) );
    VarSet("SumMon" + mon, 1 + Nz( VarGet("SumMon"+ mon ) ) );

    MaxMoProfit = Max( MaxMoProfit, Chg );
    MinMoProfit = Min( MinMoProfit, Chg );

    LastMoValue = eq[ i ];
  }
}

/////////////////////////////////////////////////
// Drawing code & helper functions
////////////////////////////////////////////////

GfxSetOverlayMode( 2 );

CellHeight = (Status("pxheight")-1)/(LastYr - FirstYr + 3 );
CellWidth = (Status("pxwidth")-1)/14;
GfxSelectFont( "Tahoma", 8.5 );

GfxSetBkMode( 1 );

function PrintInCell( string, row, Col )
{
 Color =  ColorRGB( IIf( row == 0 || col == 0 || col == 13, 220, 255 ), 255, IIf( row % 2, 255, 220 ) );
 GfxSelectSolidBrush( Color   );
 GfxRectangle( Col * CellWidth,
                    row * CellHeight, (Col + 1 ) * CellWidth + 1,
                    (row + 1 ) * CellHeight  + 1);
 GfxDrawText( string, Col * CellWidth + 1,
                    row * CellHeight + 1,
                    (Col + 1 ) * CellWidth, (row + 1 ) * CellHeight, 32+5 );
}

YOffset = 25;
XOffset = 15;

function DrawBar( text, bar, numbars, y, Miny, Maxy )
{
 BarWidth = (Status("pxwidth") - 4 * XOffset )/( numbars + 1 );
 BarHeight = Status("pxheight") - 2 * YOffset;
 relpos = ( y - Miny ) / (Maxy - Miny );

 xp = XOffset + ( bar + 0.5 ) * BarWidth;
 yp = YOffset + BarHeight * ( 1 - relpos );
 xe = XOffset + ( bar + 1 ) * BarWidth;
 ye = YOffset + BarHeight * ( 1 - ( -miny )/( maxy - miny ) );

 if( y > 0 )
 {
 GfxGradientRect( xp, yp,
                  xe , ye,
                  ColorHSB( 70, 255 * relpos, 255 ), ColorHSB( 70, 20, 255 ) );
 }
 else
 {
 GfxGradientRect( xp, ye,
                  xe , yp,
                  ColorHSB( 0, 20, 255 ), ColorHSB( 0, 255 * ( 1 - relpos ), 255 ) );
 }
 GfxTextOut( text, xp, ye );
 GfxTextOut( StrFormat("%.2f", y ), xp, yp );
}

function DrawLevels( Miny, Maxy )
{
  range = Maxy - Miny;

  grid = 100;
  if( range < 10 ) grid = 1;
  else
  if( range < 20 ) grid = 2;
  else
  if( range < 50 ) grid = 5;
  else
  if( range < 100 ) grid = 10;
  else
  if( range < 200 ) grid = 20;
  else
  if( range < 500 ) grid = 50;

  _TRACE("grid = "+grid +" range "+range );

  width = Status("pxwidth") - 4 * XOffset;
  height = Status("pxheight") - 2 * YOffset;

  GfxSelectPen( colorBlack, 1, 2 );
  for( y = grid * ceil( Miny / grid ); y <= grid * floor( Maxy / grid ); y += grid )
  {
    yp =  YOffset + Height * ( 1 -  ( y - Miny ) / (Maxy - Miny ) );

    GfxMoveTo( XOffset, yp );
    GfxLineTo( XOffset + width , yp );
    GfxTextOut( ""+ y, XOffset + 2 + width, yp );
  }

  GfxSelectPen( colorBlack, 1, 0 );
  GfxMoveTo( XOffset, YOffset );
  GfxLineTo( XOffset + width, YOffset );
  GfxLineTo( XOffset + width, YOffset + Height );
  GfxLineTo( XOffset , YOffset + Height );
  GfxLineTo( XOffset , YOffset );
}

MonthNames = "Jan,Feb,Mar,Apr,May,Jun,Jul,Aug,Sep,Oct,Nov,Dec";

function DisplayProfitTable( )
{
 Header = "Year,"+MonthNames+",Yr%";
 for( Col = 0; (Colname = StrExtract( Header, Col ) ) != ""; Col++ )
 {
  PrintInCell( ColName, 0, Col );
 }

 Row = 1;
 for( y = FirstYr; y <= LastYr; y++ )
 {
  PrintInCell( StrFormat("%g", y ), Row, 0 );
  PrintInCell( StrFormat("%.1f%%", VarGet("ChgYear" + y ) ), Row, 13 );
  for( m = 1; m <= 12; m++ )
  {
   Chg = VarGet("ChgMon" + y + "-" + m);
   if( Chg )
     PrintInCell( StrFormat("%.1f%%", Chg ), Row, m );
   else
     PrintInCell( "N/A", Row, m );
  }
  Row++;
 }

 PrintInCell("Avg", Row, 0 );
 for( m = 1; m <= 12; m++ )
 {
   PrintInCell( StrFormat("%.1f%%",  Nz( VarGet("SumChgMon" + m)/VarGet("SumMon" + m ) ) ), Row, m );
 }

}

function DisplayYearlyProfits()
{
 Bar = 0;
 for( y = FirstYr; y <= LastYr; y++ )
 {
   Chg = VarGet("ChgYear" + y );
   DrawBar( ""+y, Bar++, ( LastYr - FirstYr + 1 ), Chg, MinYrProfit, MaxYrProfit );
 }
 GfxTextOut("Yearly % Profit chart", 10, 10 );

 DrawLevels( MinYrProfit, MaxYrProfit );
}

function DisplayMonthlyProfits()
{
 Bar = 0;

 MinAvgProf = MaxAvgProf = 0;
 for( y = 1; y <= 12; y++ )
 {
   Chg = VarGet("SumChgMon" + y ) / VarGet("SumMon" + y );
   MinAvgProf = Min( MinAvgProf, Chg );
   MaxAvgProf = Max( MaxAvgProf, Chg );
 }

 for( y = 1; y <= 12; y++ )
 {
   Chg = VarGet("SumChgMon" + y ) / VarGet("SumMon" + y );
   DrawBar( StrExtract(MonthNames, y-1 ), Bar++, 13, Chg, MinAvgProf , MaxAvgProf );
 }
 GfxTextOut("Avg. Monthly % Profit chart", 10, 10 );

 DrawLevels( MinAvgProf , MaxAvgProf );
}

///////////////////////////
// This function checks if currently selected symbol
// is portfolio equity
//////////////////////////
function CheckSymbol()
{
 if( Name() != "~~~EQUITY" )
 {
  GfxSelectFont( "Tahoma", 20 );
  GfxSetBkMode( 2 );
  GfxTextOut("For accurate results switch to ~~~EQUITY symbol", 10, 10 );
 }
}

////////////////////////////
// Main program - chart type switch
////////////////////////////
type = ParamList("Chart Type", "Profit Table|Yearly Profits|Avg. Monthly Profits", 0 );

switch( type )
{
 case "Profit Table":
         DisplayProfitTable();
         break;
 case "Yearly Profits":
         DisplayYearlyProfits();
         break;
 case "Avg. Monthly Profits":
         DisplayMonthlyProfits();
         break;
}

CheckSymbol();
0 comments
Leave Comment
Please login here to leave a comment.