RAJASWAMY INTRADAY MATRIX for Amibroker (AFL)
rajaswamy over 15 years ago Amibroker (AFL)
Cycles will position the plot under the specific occurance of the cycle. A value of 0 ( Default ) will position the plot at the beginning of the last cycle in the data and will show the extrapolation into future dates for as many bars as you have defined in the AB Preferences
I GOT FROM HERE
http://niftyclinic.blogspot.com/
Screenshots
Indicator / Formula
Copy & Paste Friendly
//
// This AFL is intended to be used with any Price Data and if available CPI data
//
// If a symbol for CPI has been supplied then constant dollar plots will be shown
// The CPI data should not be less granular then the chart periodicity
//
// This AFL will produce results beginning with the second bar
//
// Bars Offset can be used to align the beginning of the cycle wherever one wants
//
// For example if the object was to see the presidential ( 4 year ) cycle
//
// Using weekly data that began 9/1/1988
//
// You would set CycleLength to 208 i.e. 52 Weeks / Year * 4 Years
//
// The first bar plotted would be for the week ending 9/2/1988
//
// In order to align this to where the presidential cycle begins i.e. 1/1/1989,
// one would change the Bars Offset to 17 to push the cycle plot ahead by 17 weeks
//
// Offset Cycles will position the plot under the specific occurance of the cycle
// A value of 0 ( Default ) will position the plot at the beginning of the last cycle
// in the data and will show the extrapolation into future dates for as many bars
// as you have defined in the AB Preferences
//
// Separators are used to place vertical separators on the plot every n-bars. In the above
// this would be set to 52 to show the different years in the weekly data of the
// presidential cycle
//
// GraphXSpace can be used to add extra space to the top and bottom of the plot
//
// RescalePrice = Yes will rescale the price data to the computed cycle ( usually not necessary )
CycleLength = Param("Cycle Length", 208, 2, 10000, 1);
OffsetBars = Param("Offset Bars", 17, 0, 10000, 1);
OffsetCycles = Param("Shift Cycles", 0, 0, 1000, 1);
Separators = Param("Separators Every ? Bars", 52, 0, 100, 1);
GraphXSpace = Param("GraphXSpace", 5, 0, 100, 1);
RescalePrice = ParamList("Rescale Price ?", "No|Yes");
SpecialData = ParamList("Year in Vol AND Month in OI ?", "No|Yes");
CPISym = "";//"CNPI-";//"CPI_1800";
OffsetBars = OffsetBars + CycleLength;
OffsetCycles = OffsetCycles - 1;
Cum1 = Cum(1) - 1;
LVC1 = LastValue(Cum1);
if (OffsetCycles < 0)
OffsetCycles = int(LVC1 / CycleLength);
if (OffsetCycles < 0)
OffsetCycles = 0;
Index = IIf(BarIndex() == 0, L, IIf(L < Ref(L, -1), L, IIf(H > Ref(H, -1), H, C)));
if (SpecialData == "Yes")
{
YYYY = V;
MM = OI;
}
else
{
YYYY = Year();
MM = Month();
}
YYYYMM = 100 * YYYY + MM;
if (CPISym != "")
CPI = Foreign(CPISym, "C");
else
CPI = Cum(0) + 1;
IndexCD = Index / CPI;
ii = IIf(Cum1 < OffsetBars + 1, 0, int((Cum1 - OffsetBars - 1) / CycleLength) * CycleLength + OffsetBars);
iii = BarsSince(ii != Ref(ii, -1)) + OffsetBars + 1;
Za = Cum(0);
Zg = Cum(0) + 1;
N = Cum(0);
for (i = OffsetBars + 1; i < BarCount; i++)
{
Y[i] = IndexCD[i] / IndexCD[ii[i]];
Za[iii[i]] = Za[iii[i]] + Y[i];
Zg[iii[i]] = Zg[iii[i]] * Y[i];
N[iii[i]] = N[iii[i]] + 1;
}
ZZa = IIf(Cum1 > OffsetBars AND
Cum1 <= CycleLength + OffsetBars, Za / N, -1e10);
ZZg = IIf(Cum1 > OffsetBars AND
Cum1 <= CycleLength + OffsetBars, Zg ^ (1 / N), -1e10);
ZZa[OffsetBars] = 1;
ZZg[OffsetBars] = 1;
ZZZa = NOT IsEmpty(Ref(ZZa, -1)) AND (BarsSince(IsEmpty(Ref(ZZa, -1)))) % Separators - 1 == 0;
ZZZg = NOT IsEmpty(Ref(ZZg, -1)) AND (BarsSince(IsEmpty(Ref(ZZg, -1)))) % Separators - 1 == 0;
Price = IIf(IsEmpty(Ref(ZZa, CycleLength)), -1e10, Ref(IndexCD, CycleLength * OffsetCycles));
PMult = LastValue(Highest(IIf(IsEmpty(Ref(Price, -1)) AND NOT IsEmpty(Price), 1 / Price, 0)));
Price = IIf(Cum1 > LVC1 - CycleLength * OffsetCycles, -1e10, Price * PMult);
if (RescalePrice == "Yes")
{
Factor = log10(LastValue(Highest(ZZa))) / log10(LastValue(Highest(Price)));
Price = Price ^ Factor;
}
MinPlot = LastValue(Min(Lowest(IIf(ZZa > 0, ZZa, 1)), Lowest(IIf(Price > 0, Price, 1))));
MaxPlot = LastValue(Max(Highest(ZZa), Highest(Price)));
Plot(MinPlot, "", colorDefault, styleNoDraw);
Plot(MaxPlot, "", colorDefault, styleNoDraw);
Plot(Ref(ZZg, CycleLength), "", colorRed, styleThick, Null, Null, CycleLength * OffsetCycles);
Plot(Ref(ZZa, CycleLength), "", colorBlue, styleThick, Null, Null, CycleLength * OffsetCycles);
Plot(Price, "", colorBrightGreen, styleThick, Null, Null, CycleLength * OffsetCycles);
Plot(IIf(Ref(ZZZa, CycleLength), 2, 1), "", colorLightBlue, styleHistogram | styleNoLabel | styleOwnScale, 1, 2, CycleLength * OffsetCycles);
if (Separators > 0)
for (i = 1; i <= int(CycleLength / Separators); i++)
{
PlotText(NumToStr(i, 1.0), CycleLength * OffsetCycles + OffsetBars + int((i - 0.5) * Separators) - CycleLength + 1, MinPlot, colorWhite);
}
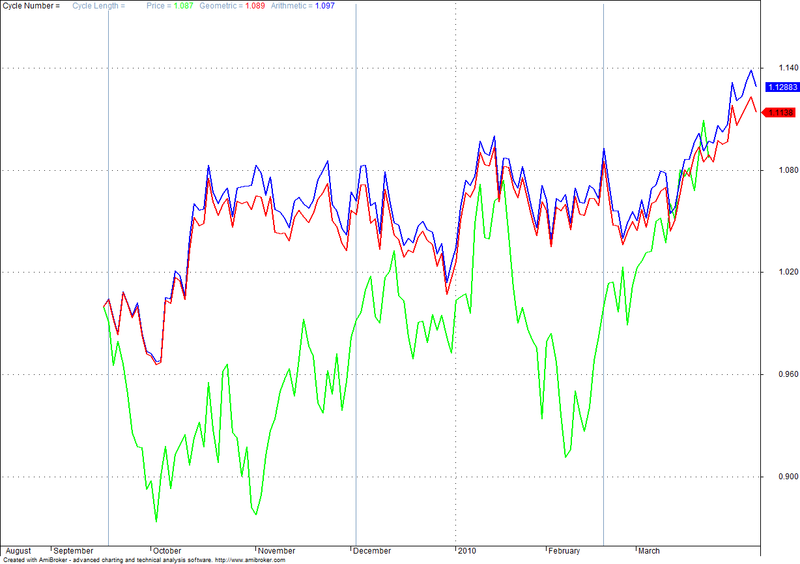
Title = "Cycle Number = " + EncodeColor(colorWhite) + NumToStr(OffsetCycles + 1, 1.0) + " " + EncodeColor(colorLightBlue) +
"Cycle Length = " + EncodeColor(colorWhite) + NumToStr(CycleLength, 1.0) + " " + EncodeColor(colorLightBlue) +
"Price = " + EncodeColor(colorBrightGreen) + NumToStr(Ref(Price, -CycleLength * OffsetCycles), 1.3) + " " + EncodeColor(colorLightBlue) +
"Geometric = " + EncodeColor(colorRed) + NumToStr(Ref(ZZg, - (CycleLength * OffsetCycles) + CycleLength), 1.3) + " " + EncodeColor(colorLightBlue) +
"Arithmetic = " + EncodeColor(colorBlue) + NumToStr(Ref(ZZa, - (CycleLength * OffsetCycles) + CycleLength), 1.3);
SetOption("NoDefaultColumns", True);
Filter = 1;
AddColumn(YYYY, "YYYY", 1.0);
AddColumn(MM, "MM", 1.0);
AddColumn(YYYYMM, "YYYY-MM", 1.0);
AddColumn(Cum1, "Cum1", 1.0);
AddColumn(Index, "Index", 1.5);
AddColumn(CPI, "CPI", 1.5);
AddColumn(IndexCD, "Index CD", 1.5);
AddColumn(ii, "ii", 1.0);
AddColumn(Y, "Y", 1.5);
AddColumn(iii, "iii", 1.0);
AddColumn(Za, "Za", 1.5);
AddColumn(N, "N", 1.0);
AddColumn(ZZa, "ZZa", 1.5);
AddColumn(PMult, "PMult", 1.5);8 comments
Leave Comment
Please login here to leave a comment.
Where to get this AFL? It is not available under the websiote you have mentioned.That website is just a subscription based tips service.
they given to me sir i dont know from were they got
not working on 5 min graph
go for 15 min it wont show buy and sell it will give the market trend up or down sply for nifty
in 5 min it worked frm 9.15 to 11.30 frm 11.30 to 12.19 the graph it displyed nothing frm 12.19 it is working but pervious data is not showing pls slove the issue
THETSIS YOUR DATA ISSU NOT INDICATOR ISHU SIR IT WORKING FOR ME IN 15 MIN ALLDAY
AFL IS NOT WORKING
AFL IS NOT WORKING