N-Period Candlesticks (Time Compression) for Amibroker (AFL)
mamunbaf9117 over 15 years ago Amibroker (AFL)
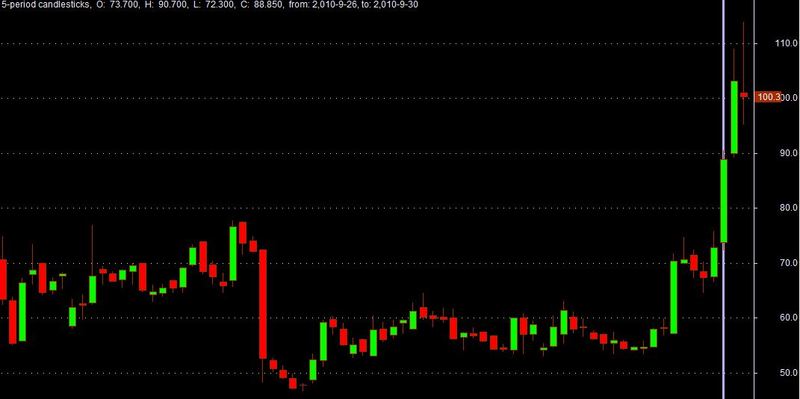
Construct n-period candlesticks while viewing any price chart. E.g. n=5 is ~weekly, n=20 ~monthly.
This saves you from creating multiple windows or switching between daily/weekly/monthly views.
By: Junya Ho
Screenshots
Indicator / Formula
Copy & Paste Friendly
_SECTION_BEGIN("N");
// compress price time series by a given factor
// e.g. 5 into 1 is like weekly view
// by Junya Ho (JUNYAdotHO@nospamUTORONTOdotCA)

barnum = Cum(1);
numbars = LastValue(barnum);
factor = 5; // compress FACTOR bars into 1

// number of compressed bars
numcbars = ceil(numbars / factor);

delta = numbars - barnum;

factorbeginidx = - factor * delta - factor + 1 + delta;
factorendidx = - factor * delta + delta;

newo = IIf(barnum < numbars - numcbars, 0, Ref(O, factorbeginidx));
newh = IIf(barnum < numbars - numcbars, 0, Ref(HHV(H, factor), factorendidx));
newl = IIf(barnum < numbars - numcbars, 0, Ref(LLV(L, factor), factorendidx));
newc = IIf(barnum < numbars - numcbars, 0, Ref(C, factorendidx));

Daystart_str = WriteVal(Ref(Year(), factorbeginidx), 1.0) + "-" + WriteVal(Ref(Month(), factorbeginidx), 1.0) + "-" + WriteVal(Ref(Day(), factorbeginidx), 1.0);

Dayend_str = WriteVal(Ref(Year(), factorendidx), 1.0) + "-" + WriteVal(Ref(Month(), factorendidx), 1.0) + "-" + WriteVal(Ref(Day(), factorendidx), 1.0);


PlotOHLC(newo, newh, newl, newc, WriteVal(factor, 1.0) + "-period price", 17, styleCandle);

Title = WriteVal(factor, 1.0) + "-period candlesticks,  O:" + WriteVal(newo) + ",  H:" + WriteVal(newh) + ",  L:" + WriteVal(newl) + ",  C:" + WriteVal(newc) + ",  from: " + Daystart_str + ", to: " + Dayend_str;

_SECTION_END();
0 comments
Leave Comment
Please login here to leave a comment.