Simple Intraday System for Amibroker (AFL)
nikh0024 over 15 years ago Amibroker (AFL)
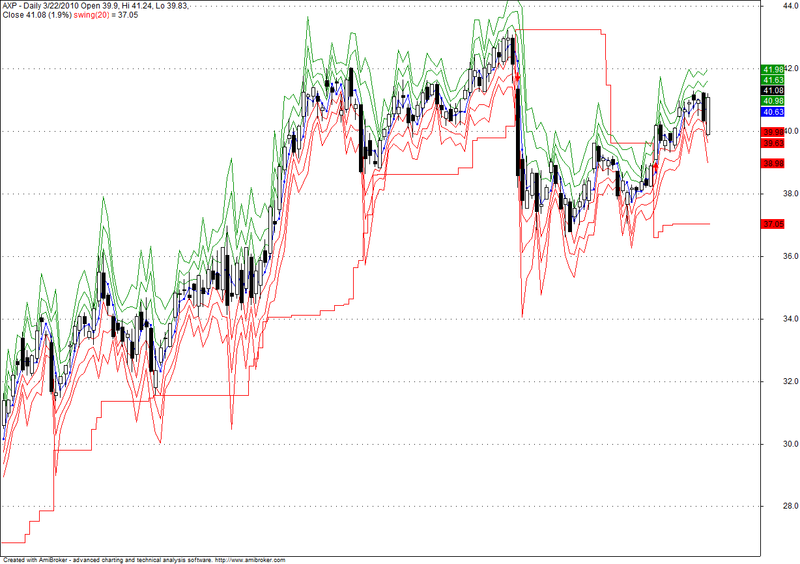
Simple intraday trading with floor pivot levels with optional Hikin Ashi candle formations. Also includes a support line.
Screenshots
Indicator / Formula
Copy & Paste Friendly
_SECTION_BEGIN("HA");

//calculates floor pivots from previous days data & plots it on the present

//GREEN LINE = RESISTANCE

//RED LINE = SUPPORT

//BLUE DOTTED LINE = PIVOT


//2 - IN - 1 PRICE CHART
Pstyle = ParamToggle("Heikin Ashi","On|Off",1);
if(Pstyle==0){
HaClose = (O+H+L+C)/4;
HaOpen = AMA( Ref( HaClose, -1 ), 0.5 );
HaHigh = Max( H, Max( HaClose, HaOpen ) );
HaLow = Min( L, Min( HaClose, HaOpen ) );
PlotOHLC(HaOpen,HaHigh,HaLow,HaClose,"",IIf(HaClose >
HaOpen,colorGreen,colorBrown),styleCandle);
_N(Title = StrFormat("{{NAME}} - {{INTERVAL}} {{DATE}} Open %g, Hi %g, Lo %g,
Close %g (%.1f%%) {{VALUES}}", O, H, L, C, SelectedValue( ROC( C, 1 ) ) ));

}
else {
_N(Title = StrFormat("{{NAME}} - {{INTERVAL}} {{DATE}} Open %g, Hi %g, Lo %g,
Close %g (%.1f%%) {{VALUES}}", O, H, L, C, SelectedValue( ROC( C, 1 ) ) ));
Plot( C, "Close", ParamColor("Color", colorBlack ), styleNoTitle |
ParamStyle("Style") | GetPriceStyle() );
}


//TIME FRAME CALCULATION
H1 = TimeFrameGetPrice("H", inDaily, -1);		// yesterdays high
L1 = TimeFrameGetPrice("L", inDaily, -1);		//				low
C1= TimeFrameGetPrice("C", inDaily, -1);		//				close
DayO = TimeFrameGetPrice("O", inDaily);			// current day open


// PIVOT Calculation
P = ( H1+ L1 + C1 )/3;
S1 = (2*P)-H1;
R1 = (2*P)-L1;
S2 = P -(H1 - L1);
S3 = S1 - (H1-L1);
R2 = P +(H1 - L1);
R3 = R1 +(H1-L1);


//PLOTS
Plot(R1, "",colorGreen,styleLine+styleNoRescale);
Plot(R2, "",colorGreen,styleLine+styleNoRescale);
Plot(R3, "",colorGreen,styleLine+styleNoRescale);

Plot(P, "",colorBlue,styleDots+styleNoRescale);

Plot(S1, "",colorRed,styleLine+styleNoRescale);
Plot(S2, "",colorRed,styleLine+styleNoRescale);
Plot(S3, "",colorRed,styleLine+styleNoRescale);

// text section

"HIGH /LOW /CLOSE = " +H +" / "+ L+" / "+ C +"\n";
"H1 /L1 /C1 = " +H1 +" / "+ L1+" / "+ C1 +"\n";

"R3 = " +R3;
"R2 = " +R2;
"R1 = " +R1;

"*************";
"p = " +p;
"*************";
"S1 = " +S1;
"S2 = " +S2;
"S3 = " +S3;

_SECTION_END();

_SECTION_BEGIN("swing");
no=Param( "Swing", 20, 1, 55 );
tsl_col=ParamColor( "Color", colorCycle );

res=HHV(H,no);
sup=LLV(L,no);
avd=IIf(C>Ref(res,-1),1,IIf(C<Ref(sup,-1),-1,0));
avn=ValueWhen(avd!=0,avd,1);
tsl=IIf(avn==1,sup,res);

Plot(tsl, _DEFAULT_NAME(), tsl_col, styleStaircase); // or styleaArea

Buy=Cross(C,tsl);
Sell=Cross(tsl,C);
shape=Buy*shapeUpArrow + Sell*shapeDownArrow;
PlotShapes(shape,IIf(Buy,tsl_col,tsl_col),0,IIf(Buy,Low,High));
_SECTION_END();
2 comments
Leave Comment
Please login here to leave a comment.
dear friend , isme sell siganal milane ke bad pivot ke niche candal jati hai to use sell kijiye usy tarah buy me bhi hai
Thanks; I noticed that when using 2 days for Swing parameters, you get the same signals as for “SWING N” indicator.
Regards,