Stock Portfolio Organizer
The ultimate porfolio management solution.
Shares, Margin, CFD's, Futures and Forex
EOD and Realtime
Dividends and Trust Distributions
And Much More ....
WiseTrader Toolbox
#1 Selling Amibroker Plugin featuring:
Advanced Adaptive Indicators
Advanced Pattern Exploration
Neural Networks
And Much More ....
Trend Advisor for Amibroker (AFL)
Rating:
4 / 5 (Votes 4)
Tags:
amibroker
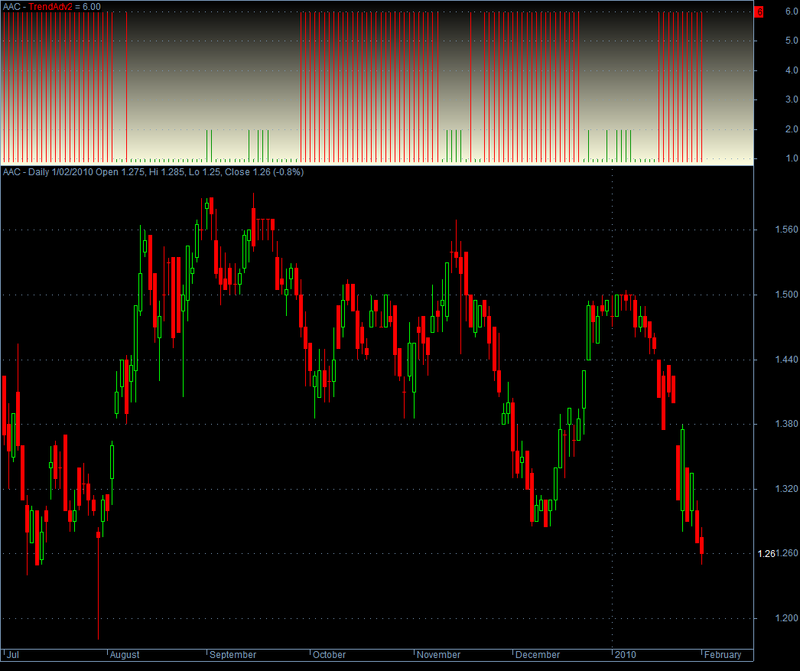
Know which stage of market you are currently in. 1) Recovery 2) Accumulation 3) Bullish 4) Warning 5) Distribution 6) Bearish
By taishunszeto
Screenshots
Indicator / Formula
Copy & Paste Friendly
pointer[0] = 0;

/* Phase filter */

Cond1 = Close > MA(Close, 50)AND NOT(Close > MA(Close, 200))AND NOT(MA(Close, 50) > MA(Close, 200));
Cond2 = Close > MA(Close, 50)AND Close > MA(Close, 200)AND NOT(MA(Close, 50) > MA(Close, 200));
Cond3 = Close > MA(Close, 50)AND Close > MA(Close, 200)AND MA(Close, 50) > MA(Close, 200);
Cond4 = NOT(Close > MA(Close, 50))AND Close > MA(Close, 200)AND MA(Close, 50) > MA(Close, 200);
Cond5 = NOT(Close > MA(Close, 50))AND NOT(Close > MA(Close, 200))AND MA(Close, 50) > MA(Close, 200);
Cond6 = NOT(Close > MA(Close, 50))AND NOT(Close > MA(Close, 200))AND NOT(MA(Close, 50) > MA(Close, 200));


for (i = 1; i < BarCount; i++)
{

  if (Cond1[i])
    pointer[i] = 1;
  if (Cond2[i])
    pointer[i] = 2;
  if (Cond3[i])
    pointer[i] = 3;
  if (Cond4[i])
    pointer[i] = 4;
  if (Cond5[i])
    pointer[i] = 5;
  if (Cond6[i])
    pointer[i] = 6;

}

/* Plot Graphic */
dynamic_color = IIf(pointer < 4, colorGreen, colorRed);
Plot(pointer, "TrendAdv2", dynamic_color, styleHistogram, Null, Null, 0);
SetChartBkGradientFill(ParamColor("BgTop", colorWhite), ParamColor("BgBottom", colorLightYellow));
5 comments
Leave Comment
Please login here to leave a comment.
Back
Can you please explain how the lines behave and what it gives as signal whether accumulation, trending, up or down. I shall be obliged at my mail removed for your safety
Did you read the description? It explains everything there. The red lines which have a value of 6 means the market is bearish and the short green lines, which have a value of 2 mean the stock is in accumulation phase. I hope that explains it.
Best Afl according to me
thanks, it’s help me more
It is My choice