Bollinger Bands HLC for Amibroker (AFL)
cyberman over 15 years ago Amibroker (AFL)
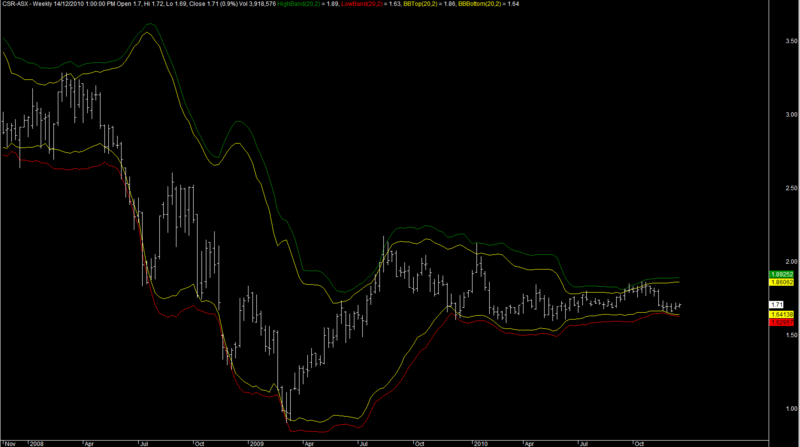
These are just like normal Bollinger bands but the High is used to calculate the upper band (Green) and the Low is used to calculate the lower band (Red) and the Close is also used to calculate both the upper and lower (Yellow).
I find that using the high to calculate the upper band is more accurate in indicating tops and using the lows to calculate the lower band is more accurate in indicating bottoms.
Screenshots
Indicator / Formula
Copy & Paste Friendly
/*Bollinger Bands HLC - cyberman

These are just like normal Bollinger bands but the High is used to calculate the upper band (Green) and
the Low is used to calculate the lower band (Red) and the Close is also used to calculate both the upper and lower (Yellow).
I find that using the high to calculate the upper band is more accurate in indicating tops
and using the lows to calculate the lower band is more accurate in indicating bottoms.*/


HighBand = High;
LowBand = Low;
CloseBand = Close;

Periods = Param("Periods",20,8,50,1);
Width = Param("Width",2,2,4,0.1);

Plot( BBandTop( HighBand, Periods, Width ), "HighBand" + _PARAM_VALUES(), colorGreen );

Plot( BBandBot( LowBand, Periods, Width ), "LowBand" + _PARAM_VALUES(), colorRed );

Plot( BBandTop( CloseBand, Periods, Width ), "BBTop" + _PARAM_VALUES(), colorYellow );

Plot( BBandBot( CloseBand, Periods, Width ), "BBBottom" + _PARAM_VALUES(), colorYellow );
0 comments
Leave Comment
Please login here to leave a comment.