Daily High Low in Advance for Amibroker (AFL)
kaiji over 15 years ago Amibroker (AFL)
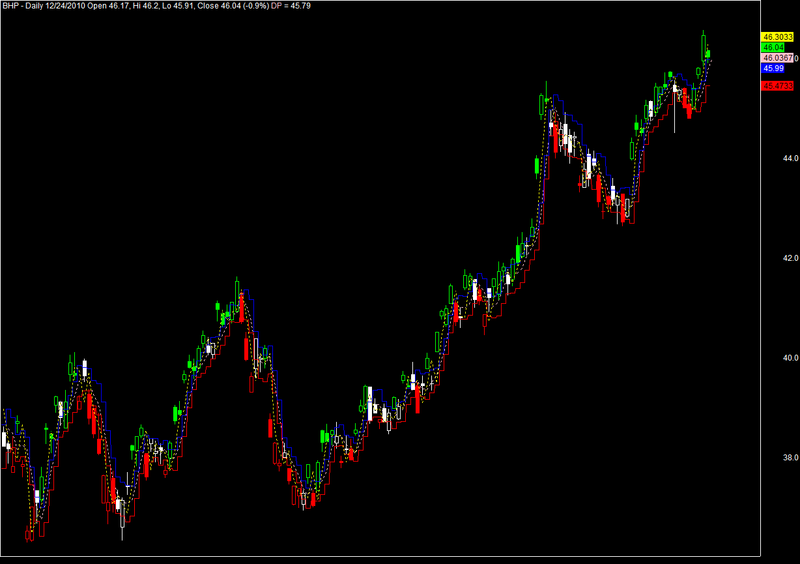
This indicator is help full for day trader as it will show you todays high and low in advance as day starts.along with daily pivot.
By Rahul Yadav – yadavrahull [at] yahoo.com
Screenshots
Indicator / Formula
Copy & Paste Friendly
_SECTION_BEGIN( "daily high low in advance" );
TimeFrameSet(inDaily);
P = Ref((L + H + C),-1)/3;
"        PPd:\t "+ P;
H1=Ref(H,-1);
"        PPd:\t "+ H1;
H2=Ref(H,-2);
"        PPd:\t "+ H2;
H3=Ref(H,-3);
"        PPd:\t "+ H3;
L1=Ref(L,-1);
"        PPd:\t "+ L1;
L2=Ref(L,-2);
"        PPd:\t "+ L2;
L3=Ref(L,-3);
"        PPd:\t "+ L3;
H= ( H1 +H2  + H3 )/3;
L= ( L1 +L2  + L3 )/3;
TimeFrameRestore();
Plot( TimeFrameExpand(P,inDaily,expandFirst),"",colorYellow,styleDashed);
Plot( TimeFrameExpand(( H1 +H2  + H3 )/3,inDaily,expandFirst),"",colorBlue,styleStaircase);
Plot( TimeFrameExpand(( L1 +L2  + L3 )/3,inDaily,expandFirst),"",colorRed,styleStaircase);
SetChartOptions(0,chartShowArrows|chartShowDates);
_N(Title = StrFormat("{{NAME}} - {{INTERVAL}} {{DATE}} Open %g, Hi %g, Lo %g, Close %g (%.1f%%) {{VALUES}}", O, H, L, C, SelectedValue( ROC( C, 1 ) ) ));
Plot( C, "Close", IIf(C> TimeFrameExpand(( H1 +H2  + H3 )/3,inDaily,expandFirst),colorBrightGreen,IIf(C<TimeFrameExpand(( L1 +L2  + L3 )/3,inDaily,expandFirst),colorRed,colorWhite  )   ) , styleNoTitle | ParamStyle("Style") | GetPriceStyle() );
_SECTION_END();
_SECTION_BEGIN("stoploss");
NewDay = Day()!= Ref(Day(), -1);
nn = StrToNum(ParamList("Days", "1|2|3|4", 1));
DH = HHV( H,NewDay);
DL =  LLV(L,NewDay);
DP=MA((DH+DL+C)/3,3)  ;
Plot(DP,"DP",colorPink,styleDashed,0,0,1);
_SECTION_END();
3 comments
Leave Comment
Please login here to leave a comment.
Very good system for swing trade.
How to interpret this system.
Can you kindly explain me the buy and sell signals for intraday trading.
For intraday which time frame will suit for this AFL?
Thanks in advance.
Regards,
Gopal
where is high & where is low????
where we bye or sell plese explain