SVE trends trail for Amibroker (AFL)
empottasch over 15 years ago Amibroker (AFL)
from: http://stocata.org/metastock/stop_trail_trends.html
coded this in AFL and later found T.Janeczko had coded it also. Results were the same. I had split it up using 2 functions but adjusted it inside 1 function for speed. Mouse right-click to change parameters.
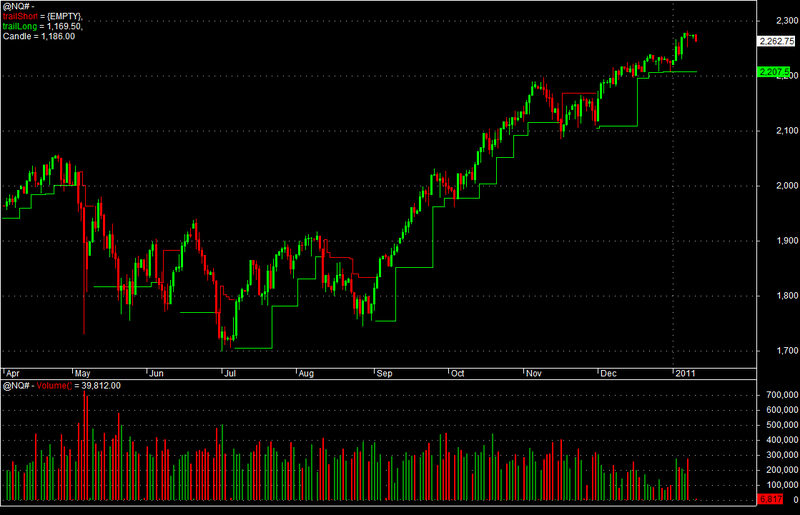
Screenshots
Indicator / Formula
Copy & Paste Friendly
function trends_func(resistance)
{
	trends = (H+L)/2; // initialize
	support = (H+L)/2; // initialize

	for( i = 4; i < BarCount; i++ )
	{
		// support
		prev = support[ i - 1 ];

		if (L[ i ] >= L[ i - 2 ]
			AND L[ i - 1 ] >= L[ i - 2 ]
			AND L[ i - 3 ] >= L[ i - 2 ]
			AND L[ i - 4 ] >= L[ i - 2 ])
		{
			support[ i ] = L[ i - 2 ];
		}
		else if (L[ i ] > H[ i - 1]*1.0013)
		{
			support[ i ] = H[ i - 1 ]*0.9945;
		}
		else if (L[ i ] > prev*1.1)
		{
			support[ i ] = prev*1.05;
		}
		else
		{
			support[ i ] = prev;
		}
		// trends
		prev = trends[ i - 1 ];

		if (H[ i ] > prev AND H[ i - 1 ] > prev)
		{
			trends[ i ] = Max(prev,support[ i ]);
		}
		else if (H[ i ] < prev AND H[ i - 1 ] < prev)
		{
			trends[ i ] = Min(prev,resistance[ i ]);
		}
		else if (H[ i ] > prev)
		{
			trends[ i ] = support[ i ];
		}
		else
		{
			trends[ i ] = resistance[ i ];
		}
	}
	return trends;
}

// AFL code by E.M.Pottasch, 12/28/2010,
// idea from: http://stocata.org/metastock/stop_trail_trends.html
atrfact = Param("atrfact",2, 1, 10, 0.1);
period = Param("period",10, 1, 100, 1);
HiLo = IIf(H-L<1.5*MA(H-L,period),H-L,1.5*MA(H-L,period));
Href = IIf(L<=Ref(H,-1),H-Ref(C,-1),(H-Ref(C,-1))-(L-Ref(H,-1))/2);
Lref = IIf(H>=Ref(L,-1),Ref(C,-1)-L,(Ref(C,-1)-L)-(Ref(L,-1)-H)/2);
diff1 = Max(HiLo,Href);
diff2 = Max(diff1,Lref);
ATRmod = Wilders(diff2,period);
loss = atrfact*ATRmod;
resistance = C + loss;
// calculate trends
trends = trends_func(resistance);

SetChartBkColor( ParamColor("ColorBG", ColorRGB( 0, 0, 0 ) ) );
GraphXSpace = 5;
SetChartOptions(0, chartShowDates);
Plot(IIf(trends > C,trends,Null),"\ntrailShort",ParamColor("ColorTrailShort",ColorRGB(255,0,0)),styleStaircase);
Plot(IIf(trends < C,trends,Null),"\ntrailLong",ParamColor("ColorTrailLong",ColorRGB(0,255,0)),styleStaircase);
2 comments
Leave Comment
Please login here to leave a comment.
I apreciate very much your work.
Please, tell me, in your opinion, wich .afl is better: “SVE trends trail” or “VSTOP3”; and why.
Thank You very much.
thanks. I have only done some backtests using VSTOP on US futures using a very simple approach by reversing the position when VSTOP changes the trend direction. I find this only gives positive results for TF and EMD futures. Others wait for a new trend and wait for a pullback within the trend. I wasn’t able to get good results with that. Did not do any backtests with the code above, regards Ed