Automatic MA for Amibroker (AFL)
wesb3189rg over 15 years ago Amibroker (AFL)
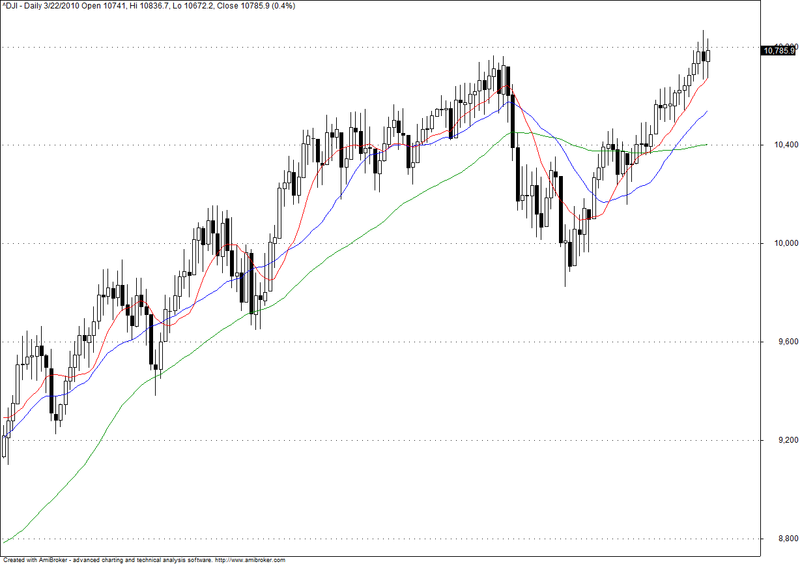
Trend Alignment from Brian Shannon’s book Technical Analysis – using Multiple timeframes.
Screenshots
Indicator / Formula
Copy & Paste Friendly
Mai=Interval();
P = Close;
x=0;
y=0;
Z=0;
A=0;
B=0;
D=0;
INDMA = ParamToggle("Automatic MA ", "On|Off",0);
if(INDMA==0){
if(Mai==60){
	x=50;
	y=100;

 }
if(Mai==180){
	x=18;
	y=50;
	Z=100;
 }
if(Mai==300){
	x=40;
	y=100;
	Z=200;
 }
if(Mai==600){
	x=20;
	y=50;
        Z=100;
 }
if(Mai==1800){
	x=7;
	y=17;
        Z=33;
 }
if(Mai==3600){
	x=4;
	y=10;
 }
if(Mai==86400){
	x=10;
	y=20;
	Z=50;
 }
if(Mai==432001){
	x=10;
	y=20;
	Z=40;
 }
 }

STMA= MA( P, x );
ITMA= MA( P, y );
LTMA= MA( P, Z );
HTFMA = ParamToggle("Higher time frame MA", "On|Off",1);
if(HTFMA==0){
if(Mai==60){
	A=200;
        B=500;
        D=1000;
 }
if(Mai==180){
	A=73;
	B=166;
	D=332;
 }
 }
HTFSTMA= MA( P, A );
HTFITMA= MA( P, B );
HTFSLTMA= MA( P, D );
Plot(STMA, _DEFAULT_NAME(), colorRed, styleLine | styleNoLabel|styleNoTitle );
Plot(ITMA , _DEFAULT_NAME(), colorBlue, styleLine | styleNoLabel|styleNoTitle );
Plot(LTMA , _DEFAULT_NAME(), colorGreen, styleLine | styleNoLabel|styleNoTitle );
Plot(HTFSTMA, _DEFAULT_NAME(), colorBlack, styleLine | styleNoLabel|styleNoTitle );
Plot(HTFITMA , _DEFAULT_NAME(), colorCustom12, styleLine | styleNoLabel|styleNoTitle );
Plot(HTFSLTMA , _DEFAULT_NAME(), colorCustom13, styleLine | styleNoLabel|styleNoTitle );
0 comments
Leave Comment
Please login here to leave a comment.