CAMARILLA hour -15min for Amibroker (AFL)
berusnet over 15 years ago Amibroker (AFL)
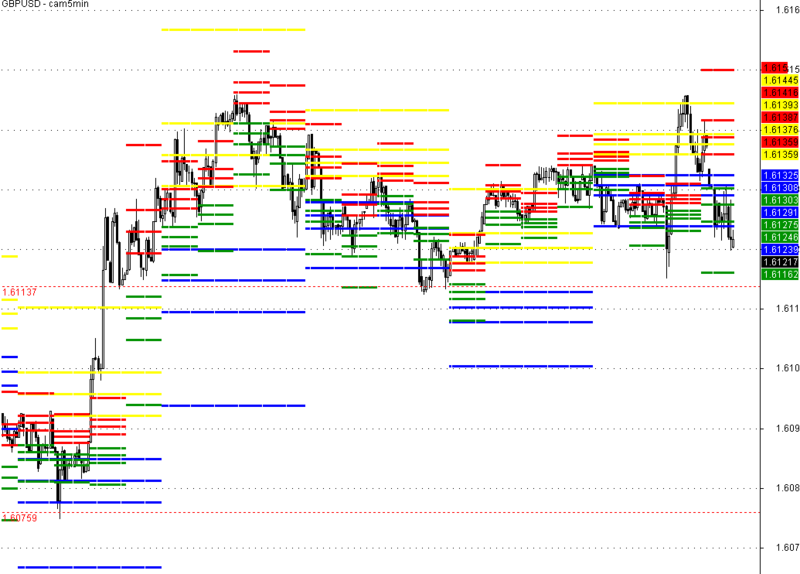
This plot camarilla pivots based on previous hour candle/15min candle
Screenshots
Indicator / Formula
Copy & Paste Friendly
_SECTION_BEGIN("camhour");
Precedente=TimeFrameGetPrice("C",inHourly,-1);
Massimo=TimeFrameGetPrice("H",inHourly,-1);
Minimo=TimeFrameGetPrice("L",inHourly,-1);
Delta=(Massimo-Minimo)*1.1;


HH4=Delta/2+Precedente;
HH3=Delta/4+Precedente;
HH2=Delta/6+Precedente;
HH1=Delta/12+Precedente;
SH1=Precedente-Delta/12;
SH2=Precedente-Delta/6;
SH3=Precedente-Delta/4;
SH4=Precedente-Delta/2;

Precedente=TimeFrameGetPrice("C",in15Minute,-1);
Massimo=TimeFrameGetPrice("H",in15Minute,-1);
Minimo=TimeFrameGetPrice("L",in15Minute,-1);
Delta=(Massimo-Minimo)*1.1;


H4=Delta/2+Precedente;
H3=Delta/4+Precedente;
H2=Delta/6+Precedente;
H1=Delta/12+Precedente;
S1=Precedente-Delta/12;
S2=Precedente-Delta/6;
S3=Precedente-Delta/4;
S4=Precedente-Delta/2;

Plot(H1,"",colorRed,styleDots+styleNoLine);
Plot(H2,"",colorRed,styleDots+styleNoLine);
Plot(H3,"",colorRed,styleDots+styleNoLine);
Plot(H4,"",colorRed,styleDots+styleNoLine);
Plot(S1,"",colorGreen,styleDots+styleNoLine);
Plot(S2,"",colorGreen,styleDots+styleNoLine);
Plot(S3,"",colorGreen,styleDots+styleNoLine);
Plot(S4,"",colorGreen,styleDots+styleNoLine);


Plot(HH1,"",colorYellow,styleDots+styleNoLine);
Plot(HH2,"",colorYellow,styleDots+styleNoLine);
Plot(HH3,"",colorYellow,styleDots+styleNoLine);
Plot(HH4,"",colorYellow,styleDots+styleNoLine);
Plot(SH1,"",colorBlue,styleDots+styleNoLine);
Plot(SH2,"",colorBlue,styleDots+styleNoLine);
Plot(SH3,"",colorBlue,styleDots+styleNoLine);
Plot(SH4,"",colorBlue,styleDots+styleNoLine);
PlotOHLC( Open, High, Low, Close, "",colorBlack , styleCandle );
_SECTION_END();
1 comments
Leave Comment
Please login here to leave a comment.
Very confusing. If only the pivots of the last bar is displayed, it will be very useful.