Trading Bands for Amibroker (AFL)
fisher over 15 years ago Amibroker (AFL)
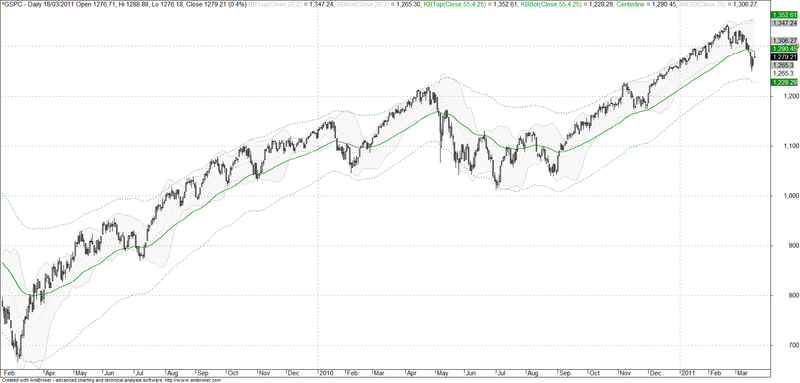
These bands are similar to what Terry Laundry uses.
Screenshots
Indicator / Formula
Copy & Paste Friendly
_SECTION_BEGIN("Price");
SetChartOptions(0,chartShowArrows|chartShowDates);
_N(Title = StrFormat("{{NAME}} - {{INTERVAL}} {{DATE}} Open %g, Hi %g, Lo %g, Close %g (%.1f%%) {{VALUES}}", O, H, L, C, SelectedValue( ROC( C, 1 ) ) ));
Plot( C, "Close", ParamColor("Color", colorBlack ), styleNoTitle | ParamStyle("Style") | GetPriceStyle() );
_SECTION_END();

_SECTION_BEGIN("Bollinger Bands");
P = ParamField("Price field",-1);
Periods = Param("Periods", 15, 2, 100, 1 );
Width = Param("Width", 2, 0, 10, 0.05 );
Color = ParamColor("Color", colorLightGrey );
Style = ParamStyle("Style") | styleNoRescale;;
Plot( bbt = BBandTop( P, Periods, Width ), "BBTop" + _PARAM_VALUES(), Color, Style );
Plot( bbb = BBandBot( P, Periods, Width ), "BBBot" + _PARAM_VALUES(), Color, Style );
PlotOHLC( bbt, bbt, bbb, bbb, "", ColorBlend( Color, colorWhite, 0.9 ), styleCloud | styleNoRescale, Null, Null, Null, -1 );
_SECTION_END();


_SECTION_BEGIN("Keltner Bands");
P = ParamField("Price field",-1);
Periods = Param("Periods", 55, 2, 300, 1 );
Width = Param("Width", 4.25, 0, 10, 0.05 );
Color = ( colorGreen );
Style = ParamStyle("Style",styleDashed);

CenterLine = EMA( P, Periods );
KTop   = CenterLine + Width * ATR( Periods );
KBot = CenterLine - Width * ATR( Periods );

Plot( KTop, "KBTop" + _PARAM_VALUES(), Color, Style );
Plot( KBot, "KBBot" + _PARAM_VALUES(), Color, Style );
Plot( Centerline, "Centerline" , colorGreen, styleThick );
_SECTION_END();

_SECTION_BEGIN("MA 20");
P = ParamField("Price field",-1);
Periods = Param("Periods", 20, 2, 300, 1 );
Plot( MA( P, Periods ), _DEFAULT_NAME(), ParamColor( "Color", colorLightGrey ), styleDashed );
_SECTION_END();
0 comments
Leave Comment
Please login here to leave a comment.