Divergence Detector for Amibroker (AFL)
hatsenlienhuong over 15 years ago Amibroker (AFL)
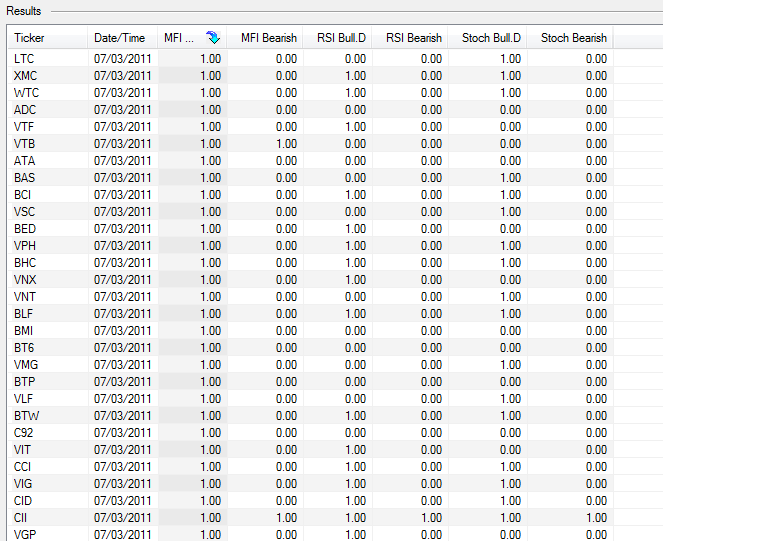
To explore divergence
Screenshots
Indicator / Formula
Copy & Paste Friendly
SetChartOptions(3,chartGridMiddle);
SetChartOptions(0,chartShowArrows|chartShowDates);
EnableTextOutput(False);
mfyperiod=Param("MFI period",14,5,100);
rsyperiod=Param("RSI period",14,5,100);

procedure CalDivergence()
{
global stchbulld;
global stchbeard;
global rsybulld;
global rsybeard;
global mfybulld;
global mfybeard;
global ispeak;
global istrough;

zzg=Zig(C,5);
// find the Peaks and trough of Close
ispeak=zzg>Max(Ref(zzg,-1),Ref(zzg,1));
istrough=zzg<Min(Ref(zzg,-1),Ref(zzg,1));


// Get the value of Price At Peaks
yp2=LastValue(ValueWhen(ispeak,C,2));
yp1=LastValue(ValueWhen(ispeak,C,1));

//yp2=(ValueWhen(ispeak,C,2));
//yp1=(ValueWhen(ispeak,C,1));

// Get the value of Price At Troughs
yb2=LastValue(ValueWhen(istrough,C,2));
yb1=LastValue(ValueWhen(istrough,C,1));

//yb2=(ValueWhen(istrough,C,2));
//yb1=(ValueWhen(istrough,C,1));

stchbulld=(yb1<yb2)*(LastValue(ValueWhen(istrough,StochK(15,3),1))>LastValue(ValueWhen(istrough,StochK(15,3),2)));
stchbeard=(yp1>yp2)*(LastValue(ValueWhen(ispeak,StochK(15,3),1))<LastValue(ValueWhen(ispeak,StochK(15,3),2)));

rsybulld=(yb1<yb2)*(LastValue(ValueWhen(istrough,RSI(rsyperiod),1))>LastValue(ValueWhen(istrough,RSI(rsyperiod),2)));
rsybeard=(yp1>yp2)*(LastValue(ValueWhen(ispeak,RSI(rsyperiod),1))<LastValue(ValueWhen(ispeak,RSI(rsyperiod),2)));

mfybulld=(yb1<yb2)*(LastValue(ValueWhen(istrough,MFI(mfyperiod),1))>LastValue(ValueWhen(istrough,MFI(mfyperiod),2)));
mfybeard=(yp1>yp2)*(LastValue(ValueWhen(ispeak,MFI(mfyperiod),1))<LastValue(ValueWhen(ispeak,MFI(mfyperiod),2)));

}
procedure DrawPrice()
{
_N(Title = StrFormat("{{NAME}} - {{INTERVAL}} {{DATE}} Open %g, Hi %g, Lo %g, Close %g (%.1f%%) Vol " +WriteVal( V, 1.0 ) +" {{VALUES}}", O, H, L, C, SelectedValue( ROC( C, 1 )) ));
Plot( C, "Close", colorBlack, styleNoTitle | ParamStyle("Style") | GetPriceStyle() );
x=Cum(1);
// Get the x-ordinate of Close at Peaks
xp1=LastValue(ValueWhen(ispeak,x,1))-1;
xp2=LastValue(ValueWhen(ispeak,x,2))-1;
//Get the x-ordinate of Close at Troughs
xb1=LastValue(ValueWhen(istrough,x,1))-1;
xb2=LastValue(ValueWhen(istrough,x,2))-1;

// Get the value of Price At Peaks
yp2=LastValue(ValueWhen(ispeak,C,2));
yp1=LastValue(ValueWhen(ispeak,C,1));
// Get the value of Price At Troughs
yb2=LastValue(ValueWhen(istrough,C,2));
yb1=LastValue(ValueWhen(istrough,C,1));


PlotShapes(IIf(x==xb1+1,shapeStar,shapeNone),colorDarkGreen,0,L,-8);
//PlotShapes(IIf(istrough,shapeStar,shapeNone),colorDarkGreen,0,L,-8);
PlotShapes(IIf(x==xb2+1,shapeStar,shapeNone),colorDarkGreen,0,L,-8);
PlotShapes(IIf(x==xp1+1,shapeStar+shapePositionAbove,shapeNone),colorRed,0,H,-8);
PlotShapes(IIf(x==xp2+1,shapeStar+shapePositionAbove,shapeNone),colorRed,0,H,-8);

}


CalDivergence();
DrawPrice();

Filter=mfybulld+mfybeard+rsybulld+rsybeard+stchbulld+stchbeard;
AddColumn(mfybulld,"MFI Bull.D");
AddColumn(mfybeard,"MFI Bearish");

AddColumn(rsybulld,"RSI Bull.D");
AddColumn(rsybeard,"RSI Bearish");

AddColumn(stchbulld,"Stoch Bull.D");
AddColumn(stchbeard,"Stoch Bearish");
5 comments
Leave Comment
Please login here to leave a comment.
Very good afl, can scanning be done when there is a star shown in the chart.
good*…
One of my very favorite afl. Frankly speaking I don’t trust any afl but this one is exception which is worthy to draw respect. Thanks lot for sharing. I would request the author or any coder to add scan option which would be greatly beneficial for a layman like me.From explore report it is really time killing and annoying to find out the potential stocks. thanks in advance.
appears nice, but the usage of zig function requires careful evaluation, it seems.
very nice, thank you !