alcoba zigzag modified for Amibroker (AFL)
radenmasmaksum over 15 years ago Amibroker (AFL)
this afl is my friend modified i just try to share his creation….
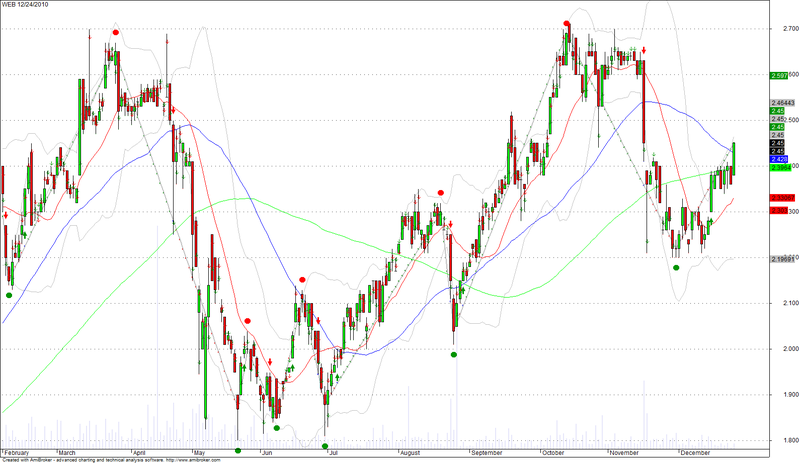
Screenshots
Indicator / Formula
Copy & Paste Friendly
_SECTION_BEGIN("Price");
SetChartOptions(0,chartShowArrows|chartShowDates);
_N(Title = StrFormat("{{NAME}} - {{INTERVAL}} {{DATE}} Open %g, Hi %g, Lo %g, Close %g (%.1f%%) Vol " +WriteVal( V, 1.0 ) +" {{VALUES}}", O, H, L, C, SelectedValue( ROC( C, 1 )) ));
Plot( C, "Close", ParamColor("Color", colorBlack ), styleNoTitle | ParamStyle("Style") | GetPriceStyle() );
if( ParamToggle("Tooltip shows", "All Values|Only Prices" ) )
{
 ToolTip=StrFormat("Open: %g\nHigh:  %g\nLow:   %g\nClose:  %g (%.1f%%)\nVolume: "+NumToStr( V, 1 ), O, H, L, C, SelectedValue( ROC( C, 1 )));
}
_SECTION_END();

_SECTION_BEGIN("MA");
P = ParamField("Price field",-1);
Periods = Param("Periods", 15, 2, 200, 1 );
Plot( MA( P, Periods ), _DEFAULT_NAME(), ParamColor( "Color", colorCycle ), ParamStyle("Style") | styleNoRescale );
_SECTION_END();

_SECTION_BEGIN("Mid MA");
P = ParamField("Price field",-1);
Periods = Param("Periods", 45, 2, 300, 1 );
Plot( MA( P, Periods ), _DEFAULT_NAME(), ParamColor( "Color", colorCycle ), ParamStyle("Style") | styleNoRescale );
_SECTION_END();

_SECTION_BEGIN("Long MA");
P = ParamField("Price field",-1);
Periods = Param("Periods", 100, 2, 400, 1 );
Plot( MA( P, Periods ), _DEFAULT_NAME(), ParamColor( "Color", colorCycle ), ParamStyle("Style") | styleNoRescale );
_SECTION_END();

_SECTION_BEGIN("BBands");
P = ParamField("Price field",-1);
Periods = Param("Periods", 15, 2, 300, 1 );
Width = Param("Width", 2, 0, 10, 0.05 );
Color = ParamColor("Color", colorLightGrey );
Style = ParamStyle("Style") | styleNoRescale | styleNoRescale;
Plot( BBandTop( P, Periods, Width ), "BBTop" + _PARAM_VALUES(), Color, Style );
Plot( BBandBot( P, Periods, Width ), "BBBot" + _PARAM_VALUES(), Color, Style );
_SECTION_END();

_SECTION_BEGIN("Volume");
Plot( Volume, _DEFAULT_NAME(), ParamColor("Color", colorLavender ), styleNoTitle | ParamStyle( "Style", styleHistogram | styleOwnScale | styleThick | styleNoLabel, maskHistogram  ), 2 );
_SECTION_END();

_SECTION_BEGIN("Price Interpretation");
movshort = ParamField("Short Time MA", 8 );
movmed = ParamField("Mid Time MA", 9 );
movlong = ParamField("Long Time MA", 10 );
btop = ParamField("BBTop", 11 );
bbot = ParamField("BBBottom", 12 );
if( Status("action") == actionCommentary )
{
width = btop - bbot;
lslop = LinRegSlope( C, 30 ) + 100;
lslo = LLV( lslop, 90 );
lshi = HHV( lslop, 90 );
lswidth = lshi - lslo;
trend = 100*( lslop - lslo )/lswidth;

mawidth = MA( width, 100 );
relwidth = 100*(width - mawidth)/mawidth;

_N( tname = Name()+"("+FullName()+")" );

printf("Price and moving averages:\n");
printf( tname + " has closed " + WriteIf( C > movshort, "above" , "below" ) + " its Short time moving average. ");

printf("\nShort time moving average is currently " + WriteIf( movshort > movmed, "above", "below") + " mid-time, AND " + WriteIf( movshort > movlong, "above", "below" ) + " long time moving averages.");

printf("\nThe relationship between price and moving averages is: "+
WriteIf( C > movshort AND movshort > movmed, "bullish",
WriteIf( C < movshort AND movshort < movmed, "bearish", "neutral" ) ) + " in short-term, and "+
WriteIf( movshort > movmed AND movmed > movlong , "bullish",
WriteIf( movshort < movmed AND movmed < movlong, "bearish", "neutral" ) ) + " in mid-long term. ");

printf("\n\nBollinger Bands:\n");
printf(tname+ " has closed " +
WriteIf( C < bbot, "below the lower band by " +
WriteVal( 100 *( bbot-C )/ width, 1.1 ) + "%%. " +
WriteIf( trend < 30, " This combined with the steep downtrend can suggest that the downward trend in prices has a good chance of continuing.  However, a short-term pull-back inside the bands is likely.",
WriteIf( trend > 30 AND trend < 70, "Although prices have broken the lower band and a downside breakout is possible, the most likely scenario for "+tname+" is to continue within current trading range.", "" ) ), "" ) +

WriteIf( C > btop, "above the upper band by " +
WriteVal( 100 *( C- btop )/ width, 1.1 ) + "%%. " +
WriteIf( trend > 70, " This combined with the steep uptrend suggests that the upward trend in prices has a good chance of continuing.  However, a short-term pull-back inside the bands is likely.",
WriteIf( trend > 30 AND trend < 70, "Although prices have broken the upper band and a upside breakout is possible, the most likely scenario for "+tname+" is to continue within current trading range.", "" ) ), "" ) +

WriteIf( C < btop AND ( ( btop - C ) / width ) < 0.5,
"below upper band by " +
WriteVal( 100 *( btop - C )/ width, 1.1 ) + "%%. ",
WriteIf( C < btop AND C > bbot , "above bottom band by " +
WriteVal( 100 *( C - bbot )/ width, 1.1 ) + "%%. ", "" ) ));

printf("\n"+
WriteIf( ( trend > 30 AND trend < 70 AND ( C > btop OR C < bbot ) ) AND abs(relwidth) > 40,
		 "This picture becomes somewhat unclear due to the fact that Bollinger Bands are  currently",
		 "Bollinger Bands are " )+
WriteVal( abs( relwidth ), 1.1 ) + "%% " +
WriteIf( relwidth > 0, "wider" , "narrower" ) +
" than normal.");

printf("\n");

printf(
WriteIf( abs( relwidth ) < 40, "The current width of the bands (alone) does not suggest anything conclusive about the future volatility or movement of prices.","")+
WriteIf( relwidth < -40, "The narrow width of the bands suggests low volatility as compared to " + tname + "'s normal range.  Therefore, the probability of volatility increasing with a sharp price move has increased for the near-term. "+
"The bands have been in this narrow range for " + WriteVal(BarsSince(Cross(-40,relwidth)),1.0) + " bars. The probability of a significant price move increases the longer the bands remain in this narrow range." ,"")+
WriteIf( relwidth > 40, "The large width of the bands suggest high volatility as compared to " + tname + "'s normal range.  Therefore, the probability of volatility decreasing and prices entering (or remaining in) a trading range has increased for the near-term. "+
"The bands have been in this wide range for  " + WriteVal(BarsSince(Cross(relwidth,40)),1.0) + " bars.The probability of prices consolidating into a less volatile trading range increases the longer the bands remain in this wide range." ,""));

printf("\n\nThis commentary is not a recommendation to buy or sell. Use at your own risk.");
}
_SECTION_END();

_SECTION_END();

_SECTION_END();

_SECTION_BEGIN("aligaristrend");
PercentChange = 6;
mystartbar = SelectedValue(BarIndex());  // FOR GRAPHING

mystartbardate = LastValue(ValueWhen(mystartbar == BarIndex(), DateNum(),1));

InitialValue = LastValue(ValueWhen(mystartbardate == DateNum(), C , 1 ) ) ;
Temp1 = IIf(BarIndex() >= mystartbar, InitialValue, Null) ;
Plot(Temp1, " ", colorBlack,styleLine);
Plot((1+(LastValue(PercentChange)/100))*(Temp1), " ", colorGreen, styleLine) ;
Plot((1-(LastValue(PercentChange)/100))*(Temp1), " ", colorRed, styleLine) ;

ZZ = Zig(C,LastValue(PercentChange)) ;
PivotLow = Ref(IIf(Ref(ROC(ZZ,1),-1) < 0 AND ROC(ZZ,1) > 0, 1, Null),1);
PivotHigh = Ref(IIf(Ref(ROC(ZZ,1),-1) > 0 AND ROC(ZZ,1) < 0, 1, Null),1);

PlotShapes( shapeCircle*PivotLow, colorGreen,0, L, -20) ;
PlotShapes( shapeCircle*PivotHigh,colorRed,0,H, 20) ;

Buy = IIf(C>(1+(LastValue(PercentChange)/100))*(ValueWhen(PivotLow, C,
1))
AND ROC(ZZ,1) > 0,1,0);
Sell = IIf(C<(1-(LastValue(PercentChange)/100))*(ValueWhen(PivotHigh, C,
1))
AND ROC(ZZ,1) < 0,1,0);

Buy = ExRem(Buy,Sell);
Sell = ExRem(Sell,Buy);

PlotShapes( shapeUpArrow*Buy, colorGreen,0, L, -20);
PlotShapes( shapeDownArrow*Sell, colorRed,0,H, -20) ;

BarColors =
IIf(BarsSince(Buy) < BarsSince(Sell)
AND BarsSince(Buy)!=0, colorGreen,
IIf(BarsSince(Sell) < BarsSince(Buy)
AND BarsSince(Sell)!=0,  colorRed, colorBlue));

Plot(C, " ", BarColors,  styleBar ) ;
Plot(ZZ," ", colorLightGrey,styleLine|styleThick);
Plot(ZZ," ", BarColors,styleDots|styleNoLine);

Title = Name() + " " + Date() + WriteIf(PivotLow, " Up Pivot
","")+WriteIf(PivotHigh," Down Pivot ","")+ WriteIf(Buy, " Buy Point ",
"") + WriteIf(Sell, " Sell Point ", "") ;
P = ParamField( "Price field" );
change = Param("% change",5,0.1,25,0.1);
z = Zig(P, change);
Plot( z, _DEFAULT_NAME(), ParamColor( "Color", colorCycle ), ParamStyle("Style") );

myBuy = IIf(z > Ref(z, -1), 1, 0);
mySell = IIf(z < Ref(z, -1), 1, 0);
Buy = Cover = ExRem(myBuy, mySell);
Sell = Short = ExRem(mySell, mybuy);
Filter = Buy OR Sell;
AddColumn(Buy, "Buy", 1.0);
AddColumn(Sell, "Sell", 1.0);
_SECTION_END();

_SECTION_BEGIN("1500");
aK = LLV(L,260);
bK = HHV(H,260);
cK= bK > aK + aK;
dK = LastValue(C);
eK = dK < bK AND dK > bK * 0.75 ;
Flx = aK AND bK AND cK AND dK AND eK ;
//... Asish vol
bVV = V > Ref(V,-1) + Ref(V,-1) * 0.8 ;
//... 4% breakout
Brk_5pc = C > Ref(C,-1) + Ref(C,-1) * 0.04;
//.... liquidity
Liquid = MA(C,21) * MA(V,21) > 25000 ;//

//....................
Ready_Steady_Go = Flx AND bVV AND Brk_5pc AND Liquid;
Buy = Ready_Steady_Go ;
Sell= 0;
Filter = Buy;
AddColumn(LastValue(C),"Currant",1.0,colorBlack,colorTan);
_SECTION_END();
1 comments
Leave Comment
Please login here to leave a comment.
The code is wrong..
Could you please post the exact code or mail me at altaf.freak@gmail.com?
AFL seems to be promising.. Looking forward for your reply!
Thanks