Fibonacci Volume for Amibroker (AFL)
halfman about 15 years ago Amibroker (AFL)
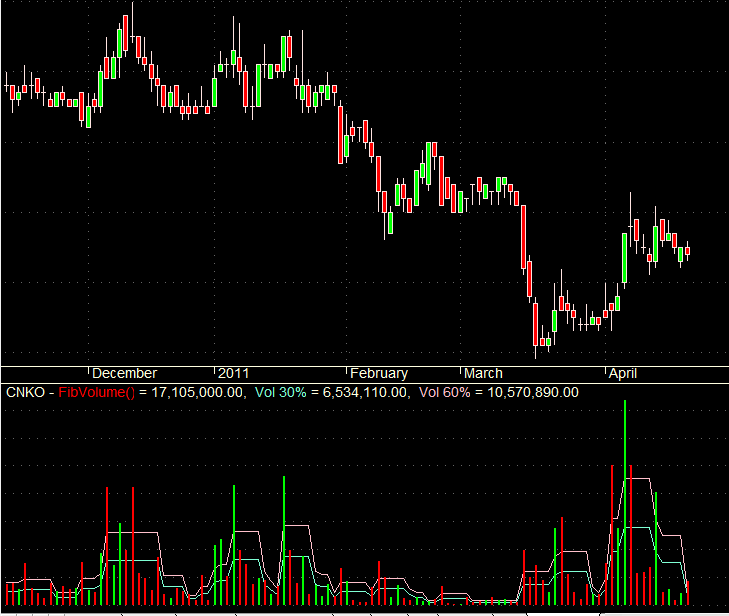
This is only a very simple formula. Use it for identify high and low volume. I think it’s better than using moving average.
Screenshots
Indicator / Formula
Copy & Paste Friendly
_SECTION_BEGIN("FibVolume");

t0=HHV(Volume ,5);

RV30=0.382*t0;
RV60=0.618*t0;

Displace=0;
Plot(RV30," Vol 30%",colorAqua,styleLine,0,0,Displace);
Plot(RV60," Vol 60%",colorPink,styleLine,0,0,Displace);


_SECTION_END();
1 comments
Leave Comment
Please login here to leave a comment.
This one is better.
_SECTION_BEGIN(“FibVolume”);
Plot( Volume, _DEFAULT_NAME(), IIf( C > O, ParamColor(“Up Color”, colorBrightGreen ), ParamColor(“Down Color”, colorRed ) ), ParamStyle( “Style”, styleHistogram | styleThick, maskHistogram ) );
t0=HHV);
Fibonacci1=ParamList(“Fib1 Level”, “0.236|0.382|0.5|0.618|0.786”, 2);
Fibonacci2=ParamList(“Fib2 Level”, “0.236|0.382|0.5|0.618|0.786”, 4);
//Convert paramlist ke number
Fib_N1=StrToNum(Fibonacci1);
Fib_N2=StrToNum(Fibonacci2);
RV1 = t0*Fib_N1;
RV2 = t0*Fib_N2;
Plot(RV1," RV1",colorAqua,styleLine,0,0);
Plot(RV2," RV2",colorPink,styleLine,0,0);
_SECTION_END();