RSI/STOCH Color candles for Amibroker (AFL)
elite about 15 years ago Amibroker (AFL)
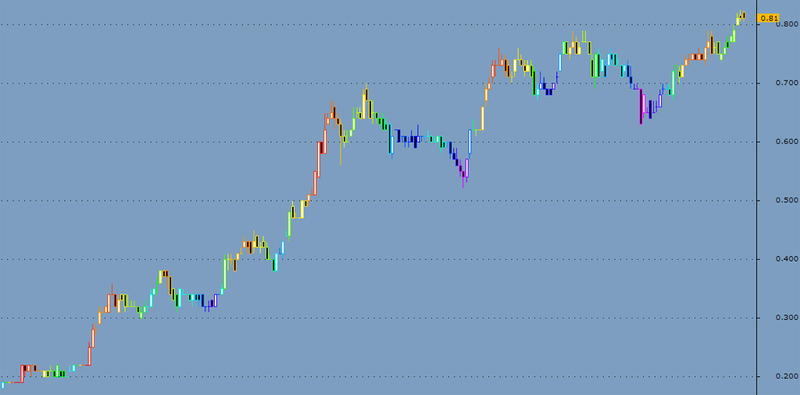
Simple OHLC plot with the color of the candles defined by the current value of the RSI/STOCHD. From violet to red, RSI/STOCHD oversold to overbought. Enjoy!
Screenshots
Indicator / Formula
Copy & Paste Friendly
Indicator = ParamList("Indicator", "RSI|STOCH");
C_mode    = ParamList("Color mode", "CM1|CM2");

function rcolor(r)
{
	Saturation0 = 255;
	Brightness0 = 255;
	Minr = LLV(r, BarCount);
	Maxr = HHV(r, BarCount);
	rn = (r-Minr)/(Maxr-Minr);
	if(C_mode == "CM1") {
		Hue0 = 220-int(rn*220.0);
	} else {
		rn = (rn/sqrt(1.0+rn^2))*sqrt(2);
		Hue0 = 220-int(rn*220.0);
	}
	return ColorHSB(Hue0, Saturation0, Brightness0);
}

Iperiod = Param("Indicator period", 13, 2, 50);

if(Indicator == "RSI") {
	Ivalue = RSI(Iperiod);
} else {
	Ivalue = StochD(Iperiod, 3, 3);
}

Plot(C, "Close", rcolor(Ivalue), styleCandle);
0 comments
Leave Comment
Please login here to leave a comment.