CENTER OF GRAVITY for Amibroker (AFL)
empottasch about 15 years ago Amibroker (AFL)
COG: Center of Gravity indicator
AFL code by E.M.Pottasch, 2011
translated from: http://chartstudio.whselfinvest.com/files/CenterGravity_0.ctl
another translation of COG. This code faster and also comes with a timer which I will post separately.
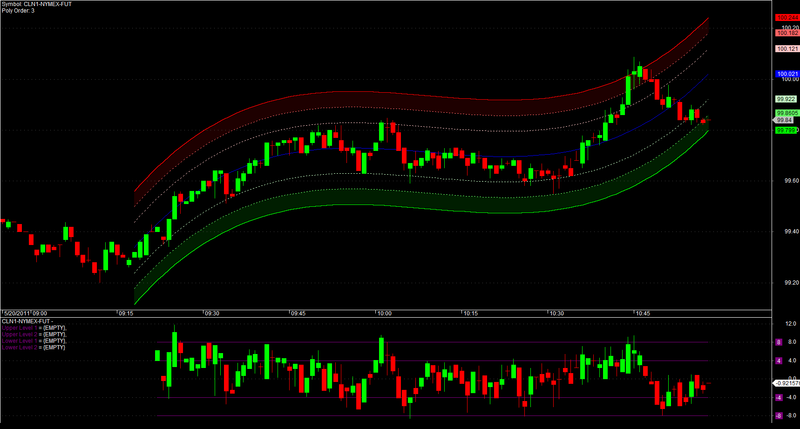
About how to use it: there is material on the internet that explains. Note that this indicator repaints. Each time a new data point come in it uses all datapoints in the range to calculate the polynomial fit. So the fit is not stationary. Therefor it looks great but its use in trading is questionable. The chart shows how it is intended to use: The bands are heading up and the price is starting to enter the green zone this is where you buy.
Screenshots
Indicator / Formula
// COG: Center of Gravity indicator
// AFL code by E.M.Pottasch, 2011
// translated from: http://chartstudio.whselfinvest.com/files/CenterGravity_0.ctl

sx=Null;b=Null;ai=Null;x=Null;
reg=x1=x2=x3=z1=z2=z3=Null;
rega=x1a=x2a=x3a=z1a=z2a=z3a=Null;

bi=BarIndex();
eb=LastValue(bi);
order=Param("n-th Order",3,1,8,1);
bars=Param("Lookback Period",100,50,500,1);
sv=ParamToggle("Use Selected Value","Off|On",1);
alt=ParamToggle("Error Levels","Fibonacci|Standard",0);
ecart=1.61803399;

if(sv)
{
	eb=SelectedValue(bi);
	bb=Max(0,eb-bars);
}
else
{
	bb=Max(0,eb-bars);
}
fin=eb;
nn=order+1;
sx[1]=bars+1;

if(fin>bars)
{
for(mi=1;mi<=2*nn-2;mi++)
{
	suml=0;
	for(n=0;n<=bars;n++)
	{
		suml=suml+n^mi;
	}
	sx[mi+1]=suml;
}
for(mi=1;mi<=nn;mi++)
{
	suml=0;
	for(n=0;n<=bars;n++)
	{
		if (mi==1)
			suml=suml+Close[fin-n];
		else
			suml=suml+Close[fin-n]*n^(mi-1);
			b[mi]=suml;
	}
}
for(jj=1;jj<=nn;jj++)
{
	for(ii=1;ii<=nn;ii++)
	{
		kk=ii+jj-1;
		ai[(ii-1)*nn+jj]=sx[kk];
	}
}
for(kk=1;kk<=nn-1;kk++)
{
	ll=0;
	mm=0;
	for(ii=kk;ii<=nn;ii++)
	{
		if(abs(ai[(ii-1)*nn+kk])>mm)
		{
			mm=abs(ai[(ii-1)*nn+kk]);
			ll=ii;
		}
	}
    if(ll==0) break;
	if(ll!=kk)
	{
		for(jj=1;jj<=nn;jj++)
		{
			tt=ai[(kk-1)*nn+jj];
			ai[(kk-1)*nn+jj]=ai[(ll-1)*nn+jj];
			ai[(ll-1)*nn+jj]=tt;
		}
		tt=b[kk];
		b[kk]=b[ll];
		b[ll]=tt;
	}
	for(ii=kk+1;ii<=nn;ii++)
	{
		qq=ai[(ii-1)*nn+kk]/ai[(kk-1)*nn+kk];
		for(jj=1;jj<=nn;jj++)
		{
			if(jj==kk)
				ai[(ii-1)*nn+jj]=0;
			else
				ai[(ii-1)*nn+jj]=ai[(ii-1)*nn+jj]-qq*ai[(kk-1)*nn+jj];
		}
		b[ii]=b[ii]-qq*b[kk];
	}
}
x[nn]=b[nn]/ai[nn*nn];
for(kk=1;kk<=nn-1;kk++)
{
	tt=0;
	ii=nn-kk;
	for(jj=1;jj<=nn-ii;jj++)
	{
		tt=tt+ai[(ii-1)*nn+ii+jj]*x[ii+jj];
		if(ai[(ii-1)*nn+ii]!=0)
			x[ii]=(b[ii]-tt)/ai[(ii-1)*nn+ii];
	}
}
for(n=0;n<=bars;n++)
{
	suml=0;
	for(kk=1;kk<=order;kk++)
	{
		suml=suml+x[kk+1]*n^kk;
	}
	reg[fin-n]=x[1]+suml;
}
}
SetChartOptions(0, chartShowDates);
Title = "Symbol: "+ Name()+ "\nPoly Order: "+order;
if(alt)
{
dev=StDev(Close-reg,bars);
sd=dev[fin];
x1a=reg+sd*1;//68%
x2a=reg+sd*2;//95%
x3a=reg+sd*3;//99.83%
z1a=reg-sd*1;
z2a=reg-sd*2;
z3a=reg-sd*3;
Plot(C, "Close",colorLightGrey,styleCandle);
Plot(reg,"reg",colorBlue,1);
Plot(x3a,"x3a",ColorRGB(255,0,0),styleThick);
Plot(x2a,"x2a",ColorRGB(255,100,100),styleDashed);
Plot(x1a,"x1a",ColorRGB(255,200,200),styleDashed);
Plot(z3a,"z3a",ColorRGB(0,255,0),styleThick);
Plot(z2a,"z2a",ColorRGB(100,255,100),styleDashed);
Plot(z1a,"z1a",ColorRGB(200,255,200),styleDashed);
PlotOHLC(x3a,x3a,x1a,x1a,"",ColorRGB(30,0,0),styleCloud|styleNoLabel,0,0,0,-1);
PlotOHLC(z1a,z1a,z3a,z3a,"",ColorRGB(0,30,0),styleCloud|styleNoLabel,0,0,0,-1);
}
else
{
dev=StDev(Close,bars);
sd=ecart*dev[fin];
x1=reg+sd/(1.382*1.618);
x2=reg+sd/1.382;
x3=reg+sd;
z1=reg-sd/(1.382*1.618);
z2=reg-sd/1.382;
z3=reg-sd;
Plot(C, "Close",colorLightGrey,styleCandle);
Plot(reg,"reg",colorBlue,1);
Plot(x3,"x3",ColorRGB(255,0,0),styleThick);
Plot(x2,"x2",ColorRGB(255,100,100),styleDashed);
Plot(x1,"x1",ColorRGB(255,200,200),styleDashed);
Plot(z3,"z3",ColorRGB(0,255,0),styleThick);
Plot(z2,"z2",ColorRGB(100,255,100),styleDashed);
Plot(z1,"z1",ColorRGB(200,255,200),styleDashed);
PlotOHLC(x3,x3,x2,x2,"",ColorRGB(30,0,0),styleCloud|styleNoLabel,0,0,0,-1);
PlotOHLC(z2,z2,z3,z3,"",ColorRGB(0,30,0),styleCloud|styleNoLabel,0,0,0,-1);
}
6 comments
Leave Comment
Please login here to leave a comment.
is it possible to share 2nd afl?
the bottom chart you mean? That is posted here: http://wisestocktrader.com/indicators/2037-center-of-gravity-timing-indicator
Iam Finding errors in the last two lines..
Line 162 & 163
Too many arguments
this is because you need to use version 5.21 or higher.
you can remove the last 4 digits, like:
PlotOHLC(x3,x3,x2,x2,"",ColorRGB(30,0,0),styleCloud|styleNoLabel);
Great stuff. Markets stay in one standard deviation 70% of the time and this boat ride along the river is jolly good ride.This type of system would reduce ones anxiety in expecting the next move.
hello ed
why do i get an out of range error?
Error 10.
Subscript out of range.
You must not access array elements outside 0..(BarCount-1) range.
is my ab version out of date?
holiday cheers!