Stock Portfolio Organizer
The ultimate porfolio management solution.
Shares, Margin, CFD's, Futures and Forex
EOD and Realtime
Dividends and Trust Distributions
And Much More ....
WiseTrader Toolbox
#1 Selling Amibroker Plugin featuring:
Advanced Adaptive Indicators
Advanced Pattern Exploration
Neural Networks
And Much More ....
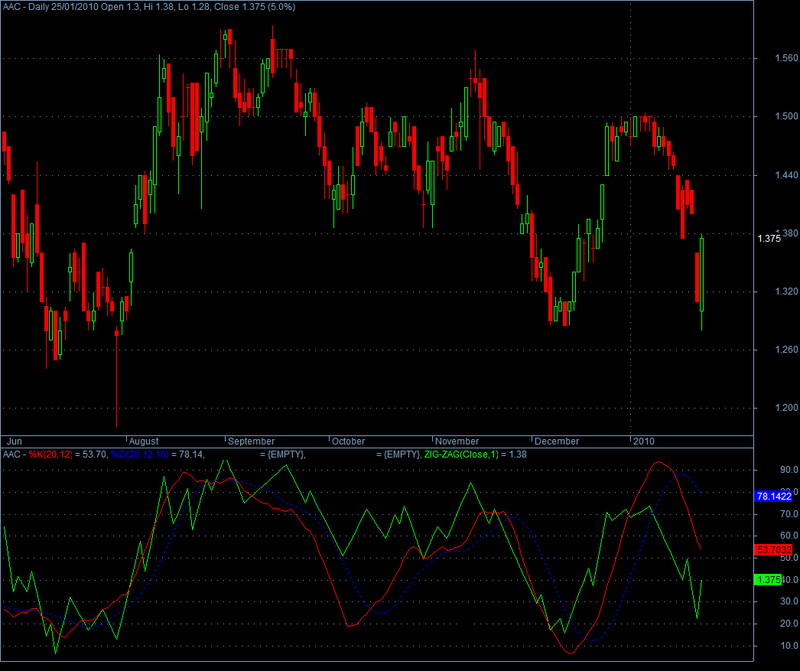
Better Stochastic 3 for Amibroker (AFL)
Rating:
3 / 5 (Votes 2)
Tags:
This formula gives buy and sell signals on divergences.
Screenshots
Indicator / Formula
Copy & Paste Friendly
_SECTION_BEGIN("Stochastic Slow");
periods = Param( "Periods", 20, 1, 200, 1 );
Ksmooth = Param( "%K avg", 12, 1, 200, 1 );
Plot( StochK( periods , Ksmooth), "%K"+_PARAM_VALUES(), ParamColor( "%K color", colorCycle ), ParamStyle("%K style") );
Dsmooth = Param( "%D avg", 10, 1, 200, 1 );
Plot( StochD( periods , Ksmooth, DSmooth ), "%D"+_PARAM_VALUES(), ParamColor( "%D color", colorCycle ), ParamStyle("%D style",styleDashed) );

y0=LastValue(Trough(StochD(periods , Ksmooth, DSmooth ),1,2));
y1=LastValue(Trough(StochD(periods , Ksmooth, DSmooth ),1,1));
x0=BarCount - 1 - LastValue(TroughBars(StochD(periods , Ksmooth, DSmooth ),1,2));
price_start=Close[x0];
x1=BarCount - 1 - LastValue(TroughBars(StochD(periods , Ksmooth, DSmooth ),1,1));
price_end=Close[x1];
Line = LineArray( x0, y0, x1, y1, 0 );
Plot( Line, "Support line", colorBlack );
Buy = y1>y0 AND price_end<price_start;
PlotShapes(shapeUpArrow * Buy, colorGreen,0,Line);

y00=LastValue(Peak(StochD(periods , Ksmooth, DSmooth ),1,2));
y11=LastValue(Peak(StochD(periods , Ksmooth, DSmooth ),1,1));
x00=BarCount - 1 - LastValue(PeakBars(StochD(periods , Ksmooth, DSmooth ),1,2));
price_start1=Close[x00];
x11=BarCount - 1 - LastValue(PeakBars(StochD(periods , Ksmooth, DSmooth ),1,1));
price_end1=Close[x11];
Line = LineArray( x00, y00, x11, y11, 0 );
Plot( Line, "Resistance line", colorBlack );
Sell = y11<y00 AND price_end1>price_start1;
PlotShapes(shapeDownArrow * Sell, colorRed,0,Line);


if( Status("action") == actionCommentary )
{
 printf("(Interpretation is not available yet)");
}
_SECTION_END();

_SECTION_BEGIN("ZIG-ZAG");
P = ParamField( "ZIG Price field" );
change = Param("% change",1,0.1,25,0.1);
Plot( Zig(P, change), _DEFAULT_NAME(), ParamColor( "Color", colorCycle ), ParamStyle("style",styleOwnScale) );
_SECTION_END();
1 comments
Leave Comment
Please login here to leave a comment.
Back
Good AFL