Gradient price for Amibroker (AFL)
vks510 about 15 years ago Amibroker (AFL)
All must look at this afl
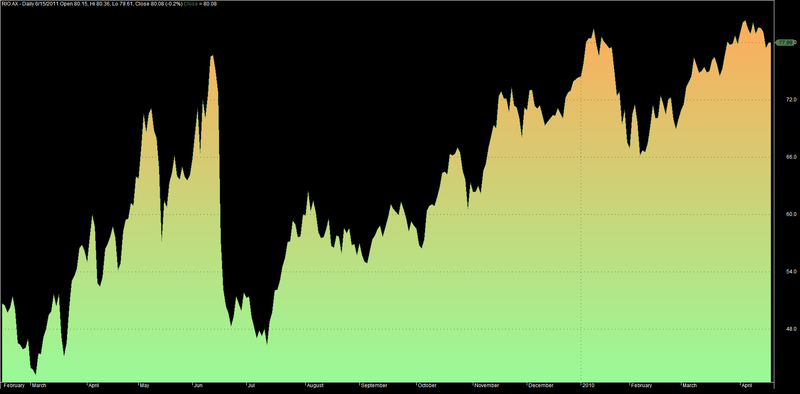
Screenshots
Indicator / Formula
Copy & Paste Friendly
function PlotGradientArea( array, caption, ColorTop, ColorBottom )
{
 bkclr = GetChartBkColor();

 HH = HighestVisibleValue( array );
 if( NOT IsNull( hh ) ) SetChartBkGradientFill( ColorTop, ColorBottom, bkclr, Null, HH );
 Plot( array, Caption, ColorBlend( ColorBottom, colorBlack ) );
 PlotOHLC( HH, HH, array, HH, "", bkclr, styleNoLabel | styleNoTitle | styleCloud, Null, Null, 0, -10 );
}

_SECTION_BEGIN("Price");
SetChartOptions(0,chartShowArrows|chartShowDates);
_N(Title = StrFormat("{{NAME}} - {{INTERVAL}} {{DATE}} Open %g, Hi %g, Lo %g, Close %g (%.1f%%) {{VALUES}}", O, H, L, C, SelectedValue( ROC( C, 1 ) ) ));
PlotGradientArea( C, "Close", ParamColor("Top", colorLightOrange), ParamColor("Bottom", colorPaleGreen ) );

_SECTION_END();
1 comments
Leave Comment
Please login here to leave a comment.
there is error :-
" HH = HighestVisibleValue( array ); "
plese check this i use ami 5.20